
November Market Wrap


If crypto remains on edge. That could be bad news for the stock market...
Crypto had a rough November. If that pain persists into December that could signal trouble ahead for the stock market.
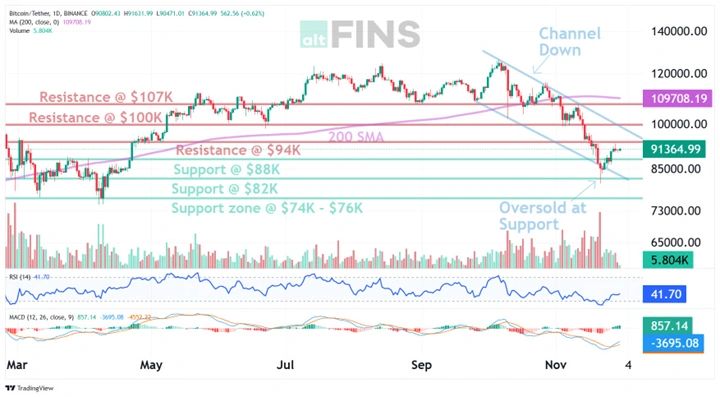
Bitcoin in recent days slumped more than 6% in 24 hours, sliding from just above $91,000 to roughly $85,600 as of Monday afternoon. The cryptocurrency sold off sharply late Sunday — tumbling more than $4,000 in just a few hours — as December trading kicked off in Asia. BTC has rebounded above $90K USD and bounced around between $85-94K USD since the start of December - is that a sign that we are on the road to recovery in December?
Bitcoin has seen intense swings in recent weeks as risk-off sentiment has spread through markets. In addition to a risk-averse mood, the latest freakout in the crypto world stems from concerns about the unwinding of a popular trading strategy.
Have we seen this Bull Run done and the end of the 4yr Bitcoin cycle and is this now the beginning of a new 2yr cycle? Bitcoin turned bullish back in March 2023 and while it's had a few Bearish fakes along the way, it has been on an upward trajectory since it bottomed out last cycle.
Have we seen the top of BTC at just over $122000 USD in October this year as it's last 4 year cycle and is this the beginning of the 2year cycle? Bitcoin topped out at around $69K USD in November 2021 and fell to its low of around $16.5K USD in December of that year (it had lost around 76% of its value from the peak of the market).
While it climbed slowly over the next 12 months it was largely very sideways and a slow gradual climb. It started to turn bullish in November of 2023 and transitioned firmly bullish from March 2024 due to the ETF approvals. We then saw it trade pretty much sideways until the "Trump Pump" of Nov/Dec 2024, where it topped out over $104K USD, then another pullback for two months where it dropped by around 20% before another pump in May which remained fairly bullish until its October top of over $122K USD.
We have just seen a pullback of over 30% but this does not align with previous bear market pullback (just yet). In theory if it follows previous patterns we expect it to pull back by around 60% from its new ATH set this cycle if it is to follow convention and the forming trend. This begs the question - Do we have one more push to a new ATH yet to come and then the big pullback or is this in fact the start of the new 2 year BTC cycle?
So, what’s going on?
Let's dig into this November Market Wrap

The Bank of Japan has signaled it could raise interest rates at its policy meeting later this month. That is throwing a wrench into a trading strategy that relies on borrowing relatively cheap Japanese yen.
For years, a lucrative trade for global investors has been to borrow yen to buy high-yielding assets like US stocks, or in this case, cryptocurrencies. Interest rates in Japan had been low or at zero, making borrowing yen relatively cheap and creating a sweet opportunity for traders. It’s known as the “yen carry trade.”
However, the Bank of Japan has signaled it could raise interest rates, in part to address stubborn inflation, continuing a recent shift away from years of ultra-low rates. Yields on benchmark Japanese bonds just hit their highest level since 2008, signaling expectations for higher rates. As rates in Japan rise, it can boost the value of the yen. That makes borrowing yen less affordable, eating into the profitability of the carry trade.
That could pressure traders to sell their bitcoin and stocks now to repay their loans and prevent the risk of further losses. In addition to a sell-off, it could lead to less cash flowing into crypto and stocks.

According to Matt Maley, chief market strategist at Miller Tabak & Co it raises questions about the unwinding of the yen carry trade … which would drain liquidity from the system and that would not be good for the stock market.
Bitcoin dipped below $84,000 Monday morning before paring some losses in the afternoon. US stocks closed lower: The Dow fell 427 points, or 0.9%. The S&P 500 fell 0.53%, and the tech-heavy Nasdaq Composite fell 0.38%.
For crypto, the sell-off has been widespread: Ether, the world’s second-largest cryptocurrency by market value, has tumbled almost 9% in 24 hours on Tuesday.

The slide in bitcoin led stocks lower and, in particular, the tech stocks that had been carrying the market. The S&P 500 fell almost 5% at one point in November before rallying and slighting gaining for the month. The tech-heavy Nasdaq posted its first losing month since March.
Markets are not out of the woods quite yet.
The current decline in bitcoin could create some real problems for the stock market. If the issues which are creating this decline do not subside, the year-end rally scenario will run into some real headwinds. This would squash any hopes for a Santa Rally for both Crypto and Stocks.
In a sign of the risk-off mood, investors are again piling in to gold and silver, which are considered safe havens amid uncertainty. The price of silver hit a record high on Monday as investors scooped up the metal, which can be considered a cheaper alternative to gold. Silver prices have doubled this year, and have also been boosted by increased industrial demand. My concern is when and how far the prices of these precious metals pull back to when the markets actually pullback in earnest.
All things considered, the S&P 500 is less than 2% below a record high set in late October. December is a historically strong month for markets, and Wall Street is leaning into bets that the Federal Reserve will cut interest rates this month, which could boost stocks. However, more volatility could be in store as bitcoin languishes more than 30% below its record high and nerves linger about the yen carry trade.
With all of this in mind, we’re still at a key juncture for the stock market. The developments out of Japan are creating some uncertainty about a year-end rally … so the ‘all clear’ flags are not flying high just yet.
ASX Tech November Winners: Horror month for the sector, but some stocks scraped through okay
The ASX tech sector copped the heaviest selling in November as investors rotated out of high-multiple growth names and back into defensives like Staples.
It was one of the worst months ever for the sector.
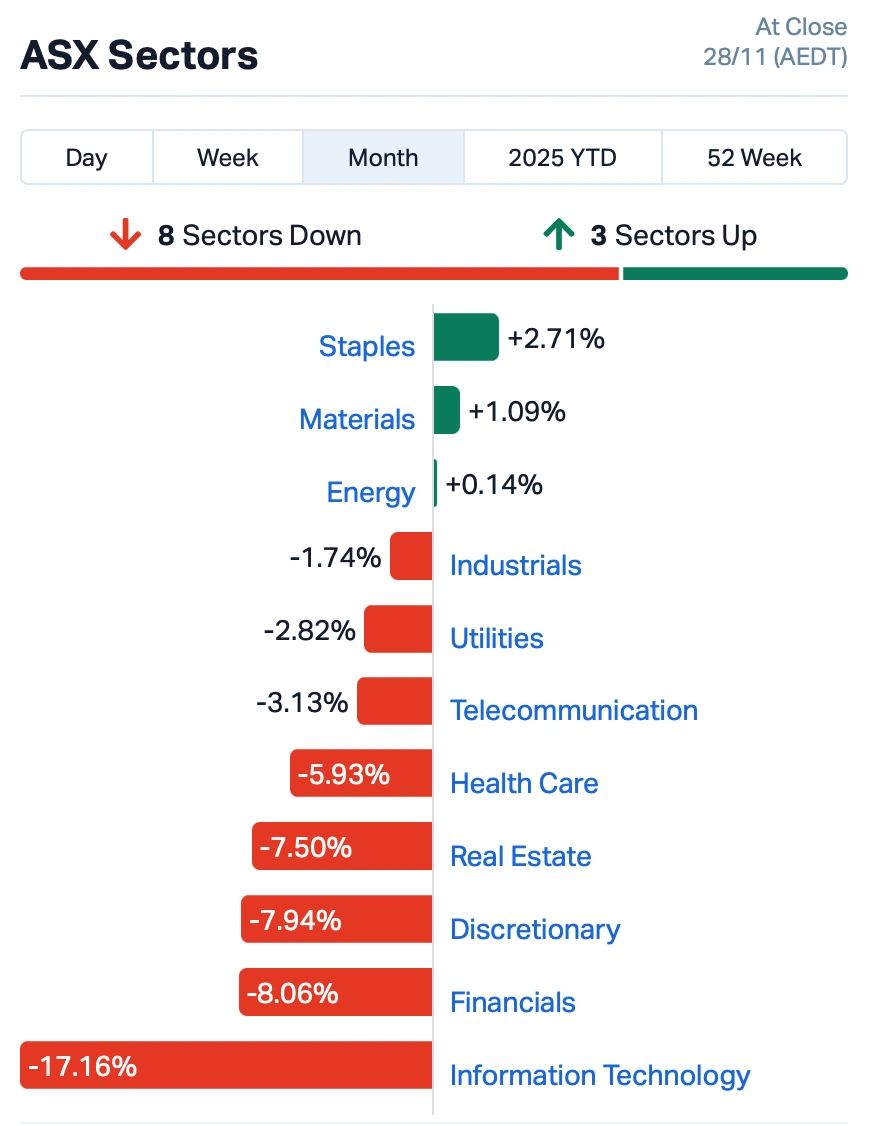
Bond yields stayed stubbornly high through most of the month, which pushed up discount rates and hit long-duration earnings – the stuff tech stocks live and die by.
At the same time, several local tech names delivered soft updates or cautious FY26 commentary, adding fuel to the risk-off mood.
Global tech sentiment didn’t help, either.
Wall Street’s mega-cap tech leaders stalled on mixed earnings and cooling AI momentum. Jitters in US tech are just a reminder of how hooked the market is on the AI story.
But experts believe that nothing in the fundamentals suggests this thing is about to pop. Like it or not, tech is still the main game in town.
Nvidia’s latest earnings, for instance, smashed expectations once again, with data-centre and AI chip sales surging as demand for its H100 and next-gen accelerators stayed red hot.
David Tudehope, CEO of Macquarie Technology Group (ASX:MAQ), said the results delivered by Nvidia underscore the strong fundamentals of the AI technology wave it’s riding.
He believes Australia is also slowly waking up to this global AI opportunity.
“When it lands fully, it will bring enormous opportunities to Australia and generate wealth right across the economy,” said Tudehope.
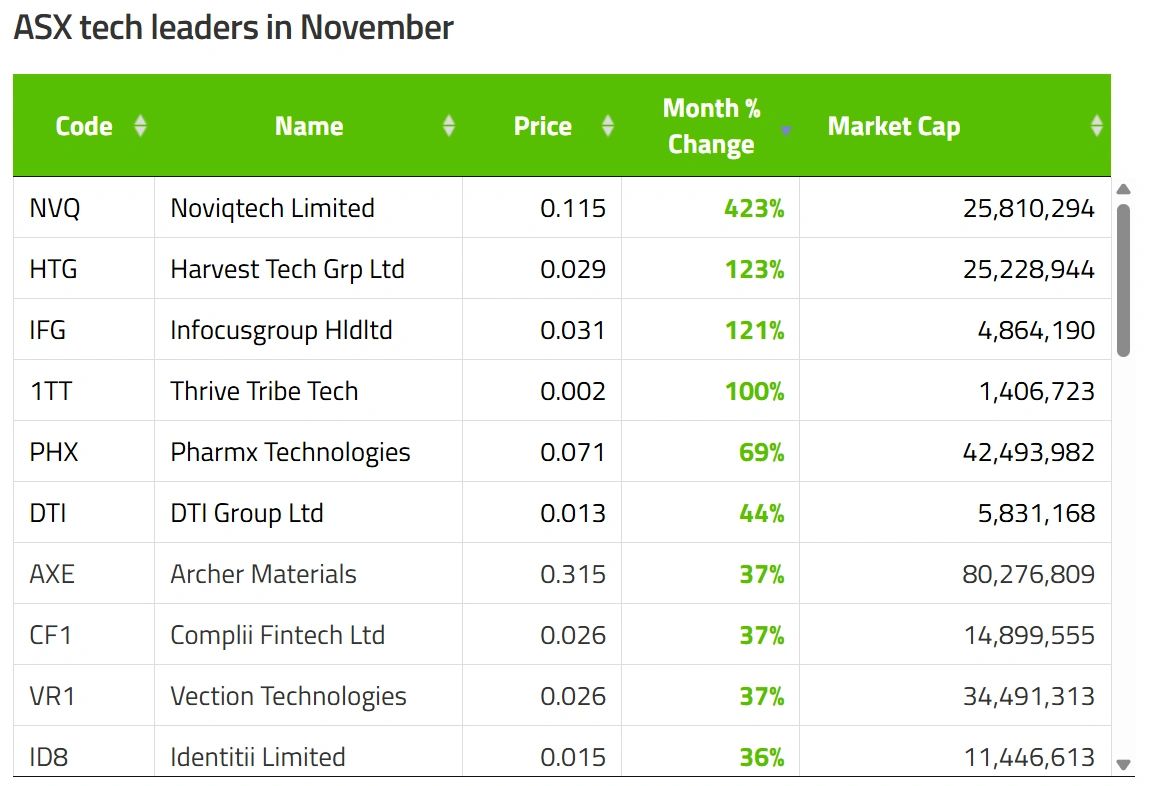
NoviqTech (ASX:NVQ)
NoviqTech didn’t drop any fresh announcements in November, but the share price had a tailwind after it kicked off trading on the US OTCQB market. The move puts it in front of US investors under the code NVQLF.
The OTCQB is a well-known platform in New York for growth companies, so the listing doubles as a nod to NoviqTech’s growing relevance in the US crypto and blockchain scene.
Earlier this year, NoviqTech teamed up with H2i Technology to tokenise emission reductions from hydrogen-enhanced diesel engines using its Carbon Central platform.
And in September, NoviqTech rolled out the beta of QI Provenance and QI AI, kicking off its quantum-classical ecosystem ahead of a Nvidia CUDA-Q upgrade promising major speed gains.
Harvest Technology Group (ASX:HTG)
During the month, Harvest locked in a major step in its global push by signing Pyxis Controls as the exclusive reseller of its Nodestream technology suite across the Middle East, North Africa, Turkey, India and South Africa.
The deal gives Pyxis the exclusive right to represent and integrate HTG’s tech.
It’s a full partnership model: Pyxis handles sales, integration and on-the-ground support, while the two share revenue on a 40/60 split (Harvest/Pyxis) with agreed minimum pricing.
Exclusivity runs for 2.5 years and renews for another 2.5 if Pyxis delivers at least $500k in gross margin to Harvest.
The agreement also includes performance-based equity options where strong sales can translate into up to $5 million in cash for Harvest through staged option exercises.
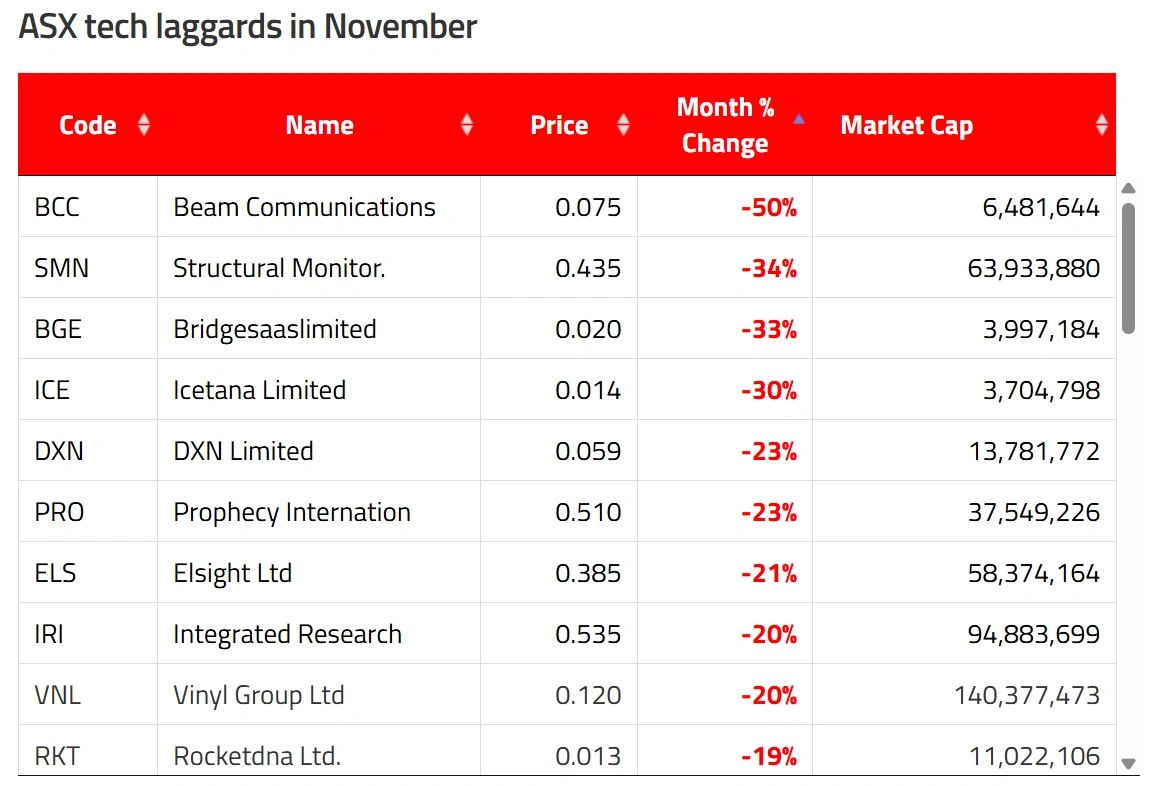
The 4 worst performing ASX 200 stocks to hold in November
Investors would have done well to avoid these four ASX 200 stocks in November.
The S&P/ASX 200 Index (ASX: XJO) slipped 3% in November, with these four ASX 200 shares all suffering much steeper falls.
So, which companies were the worst ones to buy on 31 October and hold through to market close on 28 November?
Three ASX companies in sharp reverse last month
The first ASX 200 stock investors would have done well to avoid in November is Iperionx Ltd (ASX: IPX).
Shares in the titanium products producer closed out October trading for $6.80 and ended November changing hands for $5.11 apiece. That saw the Iperionx share price down 24.9% over the month just past.
Longer term, shares remain up 13% over 12 months.
Iperionx shares came under pressure in November amid a short seller report released by Spruce Point Management.
"Based on our analysis, we believe investors should exercise caution because the shares may be significantly overvalued," the short seller noted.
Moving on to the second ASX 200 stock taking a sharp fall in November, we have TPG Telecom Ltd (ASX: TPG).
Shares in Australia's third-largest telecommunications company ended October trading for $5.53 and ended November at $3.75. This put the TPG Telecom share price down 32.2% over the month, and it sees shares down 17% in a year.
Some of that selling pressure came after the company raised $300 million through an Institutional Reinvestment Plan, issuing new shares at a 5% discount to the previous trading day's closing price.
But the biggest loss came on 14 November, when TPG Telecom shares closed down 31.1%.
However, those losses weren't as harsh as they might seem. That's because the company had just traded ex-dividend (including an outsized shareholder capital return), which saw stockholders achieving a 28.8% yield relative to the previous trading day's closing price.
Which brings us to the third fast-falling ASX 200 stock in November, Temple & Webster Group Ltd (ASX: TPW).
Shares in the online furniture and homewares retailer closed on 31 October trading for $23.81. At the end of trade on 28 November, shares were changing hands for $15.52 apiece, down 34.8% for the month.
Temple & Webster shares remain up 24% over 12 months.
Almost all of November's losses can be pinned to 26 November, when shares closed the day down a rather large 32.3%. This followed on a trading update in which the company reported that revenue from 1 July to 20 November was up 18% year on year. But that growth fell short of market expectations, and investors were quick to hit their sell buttons.

The worst-performing ASX 200 stock to hold in November
And the ignominious title of worst performing ASX 200 stock to hold in November goes to DroneShield Ltd (ASX: DRO).
Shares in the drone defence company closed on 31 October trading for $3.83 and ended November at $1.98 apiece.
This saw the DroneShield share price down a steep 48.3% over the month. Though shares remain up 163% over 12 months.
DroneShield shares faced a series of headwinds in November after notching new record highs in October.
The biggest single-day sell-off came on 13 November.
Investors sent the DroneShield share price tumbling 31.4% on the day after learning that CEO Oleg Vornik had sold $49.47 million worth of the company's shares the prior week.
Here is a great tool to check the performance of the ASX investment products month by month
https://www.asx.com.au/issuers/investment-products/asx-investment-products-monthly-report

Major asset class performance
- Global equities ended November broadly unchanged, with an early month sell-off due to AI bubble concerns eventually unwound on renewed US rate cut hopes.
- Australian equities were weaker, reflecting a relatively larger decline in valuations as firm inflation data pushed up bond yields and reduced the chances of a local rate cut next year.
- Global bond yields were broadly steady, contributing to a small gain in returns. Higher local bond yields produced a negative return on Australian bonds.
- Gold prices rose further, supported by the prospect of another US rate cut.

Greater expectation for Fed rate cuts
While many policymakers have struck a cautious tone, signals from a few key voting members in recent weeks, along with reports that White House economic adviser Kevin Hassett is a leading contender to succeed Fed Chair Jerome Powell, have heightened expectations for further interest rate cuts in the months ahead.
Powell was scheduled to speak after the market close but was unlikely to address monetary policy due to the proximity to the central bank's policy meeting.
Investors are also waiting for a delayed September report on the Personal Consumption Expenditures Price Index, the Fed's preferred inflation gauge, due on Friday.
In Australia we will not be looking at rate cuts but more than likely either rates on hold or a rate rise at the next RBA meeting in a few days time (Tuesday December 9th). We expect the RBA to leave rates unchanged but there is a high probability that rates will go up in the new year after the Christmas period. This is not thanks to everyday Aussies spending big at Christmas but rather thanks to the governments overspending - Thanks Albo!
This will change sentiment here in Australian local markets and may mute things locally in Australia for the short term.

Crypto Market Reset and Drawdown
November was the first genuine stress test of this cycle. From the October peak into the November low, more than $1.00T in crypto market value disappeared, as total market cap fell by roughly a quarter and Bitcoin dropped from above $126,000 dollars into the $80,000 range. There was no single “FTX style” trigger. The move came from a combination of spot selling, record or near record redemptions from spot Bitcoin and Ethereum ETFs, the first meaningful contraction in stablecoin supply in more than two years, a sharp reduction in derivatives leverage, and a $120 M exploit at Balancer that hit DeFi right in the middle of the volatility.
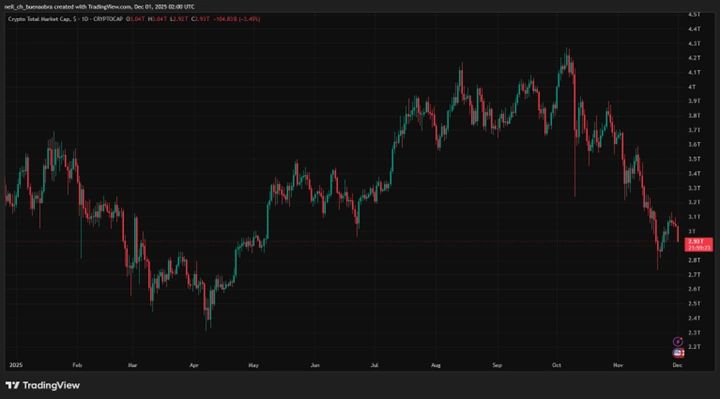
Crypto Market Cap in 2025, From Peak to November Reset
The path looked like a classic deleveraging. A break through key levels triggered margin calls and liquidations in futures and perpetual swaps. On one of the worst days, more than $2.00 B of leveraged positions were liquidated across major derivatives venues, affecting over 400,000 trader accounts. At the same time, ETF providers were selling spot to meet redemptions, and order books were thinner than in previous cycles because more ownership had moved into listed products and structures.
Importantly, there was no central infrastructure failure. Large exchanges stayed online, core stablecoins held their pegs, and settlement systems continued to work. The only major technical incident was protocol specific at Balancer, not a breakdown of custody or exchange plumbing. The price move looked like a crash, but market functioning resembled a mature system clearing excess leverage under stress. For risk committees, that is a different situation from 2022, when key venues failed outright.
Global conditions were already fragile before crypto sold off. Through October and November, markets were wrestling with stretched valuations in AI related equities, choppy macro data, and less certainty about the future path of interest rates. Coverage of the “AI bubble” debate and reports that more than $1T dollars in crypto value had been wiped out in roughly six weeks framed the move as part of a broader risk reset.
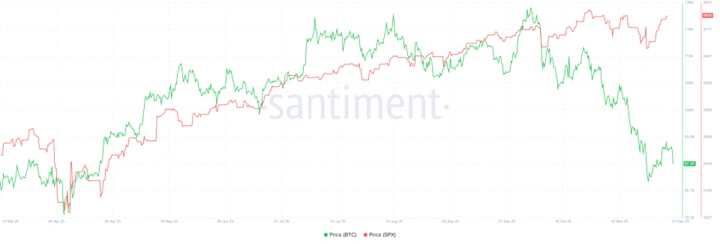
Bitcoin and SPX, Tracking 2025
United States economic data releases were disrupted by government funding problems, which created a “data fog” for policymakers and investors. Central bank communication stayed cautious and futures pricing for 2026 cuts moved around, so the clean “lower rates, higher risk assets” story that had supported Bitcoin and Ethereum earlier in the year lost some force. In practice that meant crypto was no longer being pulled higher by one simple liquidity narrative. It traded as part of a larger basket of high beta assets that were being reassessed at the same time. When confidence around those trades weakened, crypto moved with them.

Bitcoin, core asset under ETF and derivatives pressure
Bitcoin carried most of the narrative and most of the market cap loss. After setting new all time highs above $126,000 in October, the price slid into the $80,000 region by 21 November. That left Bitcoin roughly 20% to 30% below its peak and removed around $400B from its market value. Spot ETFs amplified the move with about $3.48B of net outflows from United States spot Bitcoin ETFs, the second largest monthly redemption since launch. Other flow analyses place combined outflows in a similar range, and one widely cited figure shows BlackRock’s iShares Bitcoin Trust suffering a single day outflow of roughly $523 M on 19 November.
The pattern suggests that short horizon ETF holders and leveraged traders were the main marginal sellers, rather than long term cold storage wallets. Market makers meeting redemptions sold spot and unwound hedges. Futures traders running high leverage were forced out as prices slipped. On chain work from analytics firms indicates some profit taking by large holders, but no wholesale exit from long horizon wallets and no broad wave of distressed miner selling. This clarified what ETF adoption really means. ETFs make Bitcoin easier to own but also create a channel where a few billion dollars of outflows in a short window can move price quickly when liquidity is thin. The long term supply and adoption story remains in place, but the path between milestones is now more exposed to flow-driven swings.
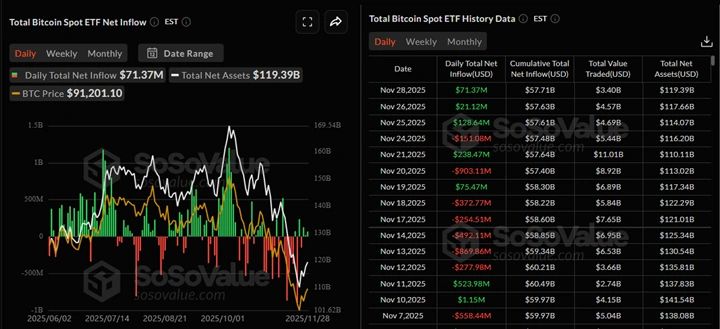
Spot Bitcoin ETF Flows, Record November Outflows
Ethereum, volatile token on top of critical infrastructure
Ethereum followed the same broad arc, with some differences. By the third week of November, ETH traded in the high $2,000s to low $3,000s, well below its 2025 highs and weaker than Bitcoin in relative terms. Spot Ethereum ETFs also saw sizable outflows. Data show about $1.42 B of net redemptions from Ethereum spot ETFs in November, the largest monthly outflow since those products launched.
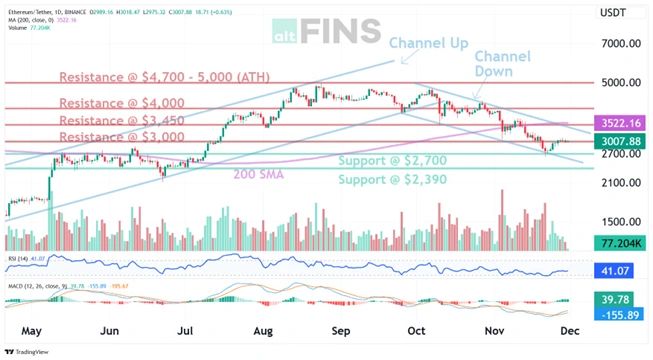
Ethereum Price vs 200 Day Moving Averages
At the same time, Ethereum remained the main settlement layer for DeFi. Total DeFi TVL fell from roughly $178B at the start of October to about $115B by late November. Even after that drop, Ethereum and its rollups hosted most of that capital, including major lending protocols, decentralised exchanges and liquid staking platforms. Networks such as Arbitrum continued to hold significant TVL and throughput despite the mark to market impact. The outcome is a split personality. The ETH token traded like a high beta growth asset caught in ETF outflows and macro de risk. The Ethereum network itself stayed at the centre of the on-chain ecosystem. For an investment committee, that means treating Ethereum as both a volatile asset and a critical piece of infrastructure, and sizing accordingly.
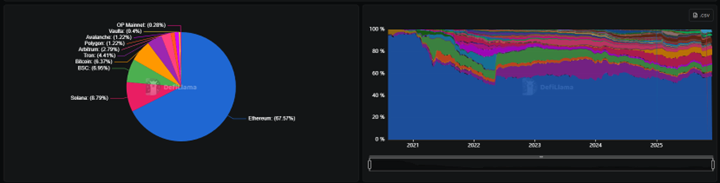

Flows, stablecoins, and derivatives
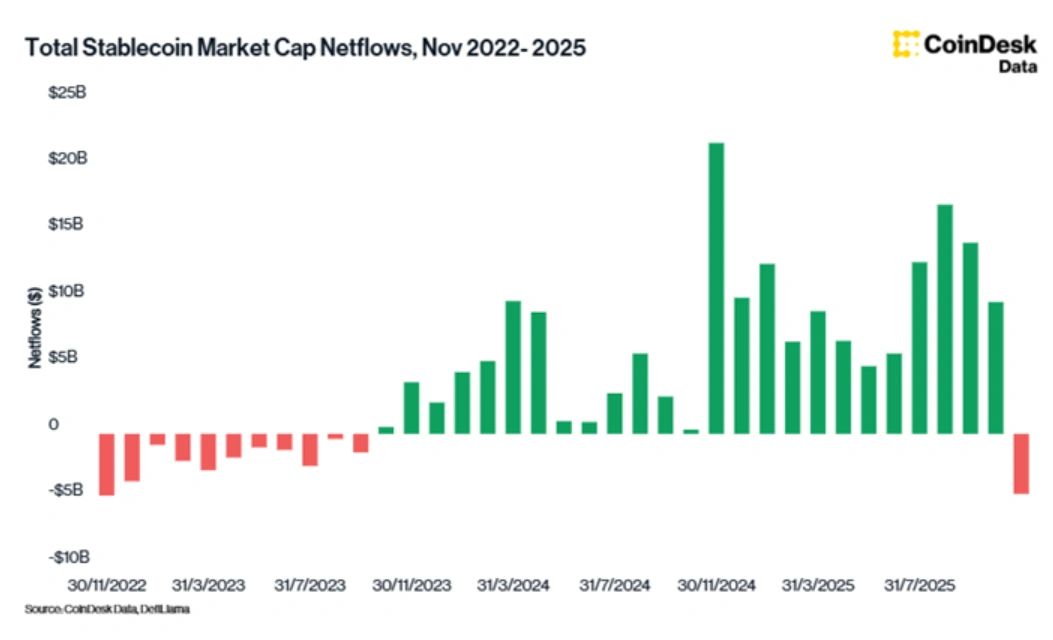
The “money layer” sent some of the clearest signals in November. Report shows aggregate stablecoin market capitalisation falling by about $4.54 B to $303B as of 24 November, a 1.48% decline and the first monthly contraction in more than two years. Stablecoin trading volumes stayed high at roughly $1.48T, and Tether still accounted for more than three quarters of centralised exchange turnover.
On the derivatives side, the reset was just as visible. Bitcoin perpetual futures open interest fell by about 35% from an October peak near $94B, signaling a clear retreat from leveraged trading. Around the worst days of the move, over $1.90 B of long positions were liquidated within hours, underscoring how much of the price action was driven by forced de risking rather than new speculative longs. In the options market, data show 25 delta skews turning sharply positive and “defensive positioning dominating market structure,” as traders paid more for downside protection and used bounces to add hedges instead of chasing upside.
Taken together, stablecoin supply and derivatives positioning describe a coordinated de-risk. Less stablecoin “float” on chain means less cash and collateral sitting in wallets and pools. Lower futures open interest and more defensive options skew show that leverage is being taken out of the system and that traders are spending more premium on protection. None of these changes take the market back to 2022 style crisis conditions, but they are large enough to shape how price moves and how quickly liquidity and risk appetite can return.

DeFi and the Balancer exploit
DeFi felt both market pressure and a direct security hit. Total DeFi TVL fell from around $178B in early October to roughly $115B by late November, including a 12.45$ drop in the week ending 9 November, the sharpest weekly contraction since the 2023 bear market. On 3 November, Balancer v2 suffered a complex exploit that targeted Composable Stable Pools. Security reviews estimate that the attacker drained more than $125M across several chains and Balancer forks by abusing a precision and rounding issue in how scaling factors were calculated in the pool math.
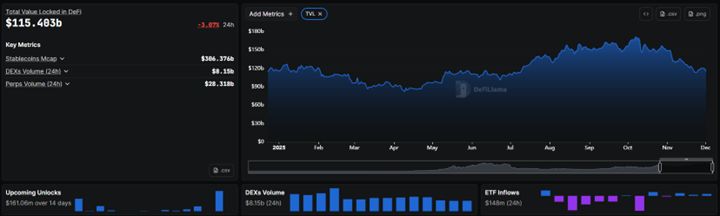
DeFi TVL Shift, Ethereum and Rollups Through the November Drawdown
Most of the TVL decline came from price effects and de risked positions, but the Balancer loss added a sharp, protocol specific shock exactly when conditions were already stressed. It is a reminder that complex DeFi systems can hide bugs that only become exploitable when size, liquidity and behaviour line up in a particular way. Even so, the broader DeFi ecosystem held together. Major lending protocols, decentralised exchanges and rollups continued to operate, liquidations were processed, and there was no cascade of protocol failures.

Altcoins, Memecoins and NFTs
The sharpest percentage moves in November happened at the speculative edge. KuCoin and other trackers describe memecoins as being down about 66% from their 2025 peak, with more than $5.00 B in sector value wiped out in a single 24-hour window around 21 November. Sector data show memecoins down about 19% over the month, alongside similar high teens drawdowns in DeFi and other high beta sectors, while NFT related tokens, staking services, gaming, RWA and data availability names fell roughly 25% to 33%, clearly leading the declines. This put combined memecoin market capitalisation at roughly $39.40 B after the move, down from about $44.00 the day before.
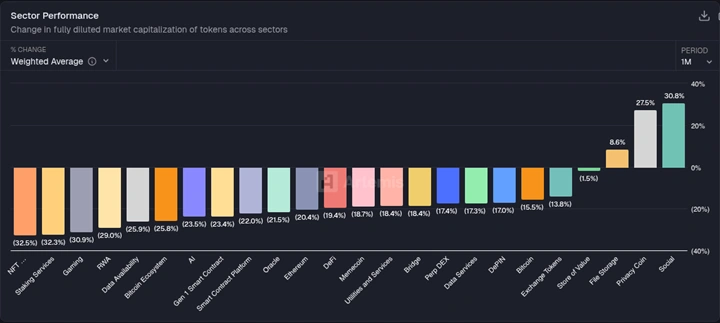
Sector Performance
NFTs also slumped. One summary notes that NFT market capitalisation fell from about $4.90B to under $3.00B over roughly a month, taking the sector back to levels last seen in April, consistent with the sector chart that shows NFT tokens down more than 30% for the period.
These markets trade mainly on sentiment and liquidity. They usually lack cash flows, and order books are thin compared with majors or large infrastructure tokens. When Bitcoin sells off, ETF flows reverse and leverage is cut, there is little reason for marginal capital to stay in pure narrative tokens. A 20% to 30% move in Bitcoin translated into much larger moves in these pockets because each unit of selling pushed prices further, which is visible in the chart where Bitcoin and exchange tokens are down about 16 and 14 percent, less than the declines in the speculative sectors that sit to their left.
In contrast, large layer one and layer two platforms, DeFi blue chips and real world asset tokens behaved more like expected high beta assets. They fell, often more than Bitcoin on a percentage basis, but did not show the same depth of collapse seen in memecoins or thin NFT collections. The same sector view also shows a small store of value basket roughly flat for the month, and pockets of strength in file storage, privacy and social tokens, which finished up about 9%, 28% and 31% respectively, suggesting that some investors rotated within crypto rather than exiting entirely.

Regulation and “Coin Laundry”
November also changed the tone around regulation and public perception. The International Consortium of Investigative Journalists launched “The Coin Laundry”, a project with 37 media partners that examined how criminal networks have used exchanges, ATMs and crypto to cash services to launder funds. The reporting highlighted that brand name platforms such as Binance and OKX processed flows linked to scams, drug trafficking and human exploitation, often because of gaps in know your customer controls and lightly regulated cash storefronts.
At the same time, regulators kept refining their approach to tokenisation and stablecoins. Central bank financial stability reviews and work on stablecoins describe these instruments as both a rapidly growing payment rail and a possible source of funding and run risk if oversight is weak. IOSCO’s final report on tokenisation emphasised that tokenised securities should sit inside the standard regulatory perimeter, with technology neutral rules around legal ownership, settlement and operational resilience.
Venues and services that cut corners on compliance can expect more scrutiny and higher enforcement risk. Instruments and platforms that resemble traditional securities and payment systems, and that accept full regulation, are being pulled into familiar rule sets rather than left in limbo.Counterparty due diligence and venue selection will matter more. Regulated ETFs, tokenised bonds and institutional stablecoins are likely to become easier to justify within existing governance frameworks.

Where to from here this cycle
November 2025 delivered a set of consistent signals. Crypto traded as part of a broader risk reset. The selloff aligned with concern around AI equity valuations, less clarity on the policy path and a general de risk across high beta assets, rather than an idiosyncratic crypto failure. Bitcoin and the stock market both pulled back at a similar time.
Flows were central to the story. A first stablecoin contraction in more than two years, roughly $3.5B of outflows from United States spot Bitcoin ETFs, about $1.4B from Ethereum ETFs, and a one third drop in futures open interest all contributed to a 20% to 30% drawdown in Bitcoin and more than $1T in lost market value. Core infrastructure bent but did not break. DeFi TVL fell by about $55B, and Balancer lost more than $120M to an exploit, yet key lending and trading protocols remained live and solvent.
Dispersion widened at the edge. Infrastructure, DeFi blue chips and real world asset platforms behaved like high beta extensions of majors. Memecoins and NFTs behaved like pure sentiment and suffered far deeper losses.
Regulation and public scrutiny tightened in a targeted way. “Coin Laundry” exposed ongoing weaknesses in compliance at some venues, while tokenisation and stablecoin reports showed regulators working to integrate core instruments into existing frameworks instead of excluding them. These are themes to lift above the noise. November was not only “a bad month.” It was a live test of how an ETF and stablecoin centric crypto market behaves under stress. The system held, but it made very clear where the levers now sit: macro visibility, ETF and stablecoin flows, DeFi protocol risk, sector dispersion and the regulatory trajectory.
We are seeing much more influence between the traditional sector and Crypto, the fact that Bitcoin pulled back only as far as it did signals that there is more upside yet in this cycle. If Bitcoin had pulled back by roughly 60% or so, then it would be pretty safe to say that we are in firm bear market territory. We need Bitcoin as the barometer to climb above $95K USD and hold, then climbing above $100-104K USD will be the next marker.
At this early stage of December, I am not confident in a Santa rally for crypto but let's see how it plays out this weekend to round out the first week of December. We have seen a renewed interest in Privacy coins in recent months and Z Cash and Dash have been performing well. It appears they are running out of steam now but their pullback has lagged behind the rest of the market. I'm confident that we will see them regain some ground along with the market in the coming months.
The time is good now to DCA and top up your positions in your chosen projects, it's also a great time for miners to add machines and add hashrate before machine prices take off again. There is one question that remains - which tokens will pump first; how high can they go and will there be multiple pumps? Stay tuned to find out more as we follow this cycle.
Happy Mining
Rusty Rigs



Disclaimer: The content on this site and in this communication should not be considered investment or financial advice. Any investing or crypto mining is speculative. When investing your capital is at risk, please do your own research and invest and make your decisions wisely. Mining profits are not guaranteed and may vary over time depending on the market performance and network hashrates. The views and opinions expressed by the author are for informational purposes only and do not constitute financial, investment, or other advice.