
The Dollar Devaluation – Does the Money Printer Still Go Brrr???

By 1973, the “gold standard” application of devaluation would end, and developed countries began using fixed exchange rates to value their currency. In many African countries, devaluations of local currency are a frequent event. However, in 1994 the French government unilaterally devalued the African franc, based on the French franc, by 50%.
Some famous currency devaluations…..
1. Zimbabwean Dollar (2010s): Ah, Zimbabwe—the poster child for hyperinflation. In the 2010s, their currency went through a wild ride. At one point, inflation rates soared to over 100,000 percent! Imagine needing a 10 million-dollar note just to buy a loaf of bread. 🥖
2. Guinean Franc (2000s): Guinea also had its currency woes. In the early 2000s, their franc experienced a dramatic devaluation. It’s like they were playing a high-stakes game of Monopoly, but instead of Regent Street, they landed on “Economic Abyss.” 🎲
3. Sao Tome and Principe Dobra (2000s): These beautiful islands off the coast of Africa faced currency challenges too. Their dobra danced a tango with devaluation, leaving folks scratching their heads. 🌴
4. Indonesian Rupiah (1990s): Indonesia had its fair share of economic turbulence. The rupiah took a nosedive during the Asian financial crisis. It’s like their currency was on a bungee jump, but the cord snapped halfway down. 🪂
5. Yugoslav Dinar: Ah, Yugoslavia—the land of shifting borders and complex history. Their dinar went through multiple iterations, and at times, it felt like a game of “Guess the Exchange Rate.” Spoiler alert: Nobody won. 🗺️
6. Vietnamese Dong (1980s): Vietnam’s dong (yes, that’s their actual currency name) faced challenges during the ’80s. It’s like they were playing limbo with their exchange rate—how low can you go? 🎵
7. Iranian Rial (1970s): The rial waltzed through the ’70s, losing value faster than a melting ice cream cone on a hot summers day at Ramsar on the Caspian Shore! 🍦
There are also stories of Greece and others along the way with their currency woes…. here is a great article from Time magazine that delves back to the 70’s when the western world veered from conventional monetary policy and a Gold Backed currency. MONEY: The Winners and Losers from Devaluation | TIME
The Devaluation of the U.S. Dollar Over the Past 15 Years
The U.S. dollar, often hailed as the world’s primary reserve currency, has had quite the rollercoaster ride over the past 15 years. There are economic twists, policy turns, and global drama that have shaped the US dollar’s value. Since January 2020, the United States has printed nearly 80% of all U.S. dollars currently in circulation. It’s pretty alarming right, 80% is a whopping number, not 28% or 18% those figures would be a worry – even 8% is still a pretty high number in a relatively short space of time. Currency in circulation refers to the amount of cash–in the form of paper notes or coins–within a country that is physically used to conduct transactions between consumers and businesses. Currency in circulation is all of the money that has been issued by a country’s monetary authority, minus cash that has been removed from the system. Currency in circulation represents part of the overall money supply, with a portion of the overall supply being stored in checking and savings accounts.
Currency in circulation can also be thought of as currency in hand because it is the money used throughout a country’s economy to buy goods and services. Monetary authorities of central banks pay attention to the amount of physical currency in circulation because it represents one of the most liquid asset classes. Currency in circulation is less important to central banks’ monetary policy relative to other types of money (for example bank reserves) because the quantity of currency is relatively less flexible.
In the U.S., a new currency is printed by the Treasury Department and distributed by the Federal Reserve Banks to banks that order more currency. The amount of U.S. currency in circulation has increased over the years as a result of demand from the international market. According to the Treasury Department, more than half of U.S. currency in circulation is found overseas rather than domestically. Overseas demand for U.S. currency stems in part from the relative stability of U.S. currency compared with nations that have more volatile currency valuations. However, that landscape is quickly changing and the demand for the US dollar is under threat.
As of January 6, 2020, the US Federal Reserve held around $4 trillion. Since then, there have been significant shifts. The Fed ramped up its quantitative easing efforts—often termed as money printing—to bolster liquidity in US banks and infuse trillions of dollars into the economy. As a result of this US inflation reached a 40 year high in Feb 2022 – this is a direct result of the “free money” issued via QE campaigns during the Covid era in an attempt to ward off recession and sadly many governments around the world followed suit and I have covered this off in the past. 80% of all US dollars in existence were printed in the last 22 months (from $4 trillion in January 2020 to $20 trillion in October 2021) – UPDATED – Tech Startups
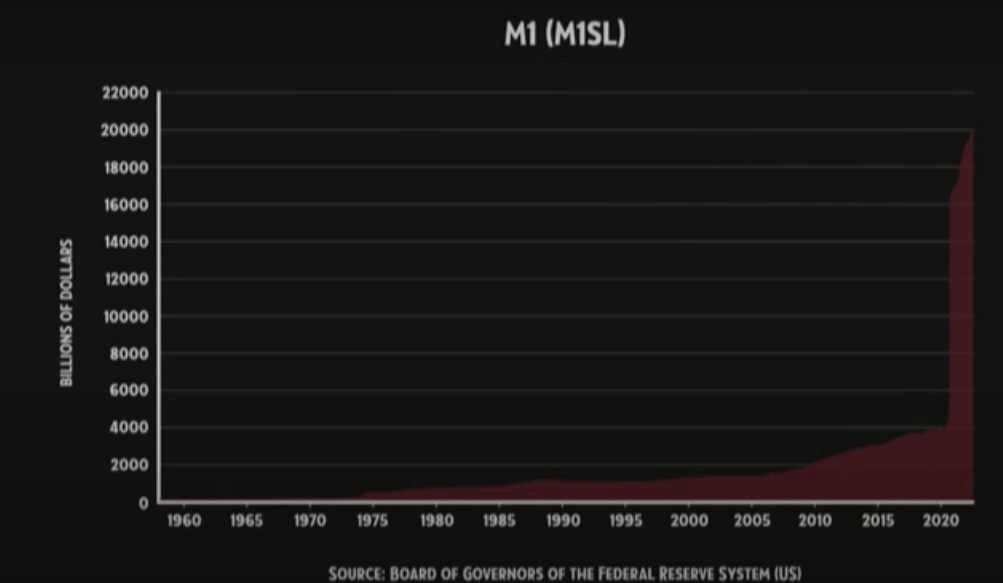
2009-2014: Post-Financial Crisis Recovery
In the wake of the 2008 financial crisis, the U.S. dollar initially flexed its muscles as investors flocked to safe-haven assets. But then came the Federal Reserve’s quantitative easing (QE) programs, which were like giving the economy a caffeine boost. While some worried about inflation and devaluation, the dollar held its ground, thanks to the sluggish recovery of other major economies. It was like watching a heavyweight champion stay on top despite the odds.
2015-2019: Relative Stability and Gradual Strengthening
From 2015 to 2019, the U.S. dollar enjoyed a period of relative calm and gradual strengthening. The Federal Reserve started raising interest rates from rock-bottom levels, attracting foreign investment like bees to honey. Geopolitical uncertainties, such as Brexit and trade tensions, only added to the dollar’s allure as a safe-haven currency. It was a time when the dollar strutted its stuff on the global stage.
2020-2021: Pandemic-Induced Volatility
Enter the COVID-19 pandemic, and the financial markets went on a wild ride. Initially, the dollar surged as investors sought safety in the storm. But the Federal Reserve’s aggressive monetary policy response, including slashing interest rates to near zero and rolling out massive QE programs, led to a significant devaluation. By the end of 2020, the dollar had taken a hit, much like a boxer staggering after a tough round.
2022-2024: Inflation and Policy Shifts
In recent years, inflation has been the pesky mosquito buzzing around the U.S. economy. The Federal Reserve’s efforts to combat inflation through interest rate hikes have had mixed results. While higher interest rates typically boost the dollar, persistent inflation and global economic uncertainties have kept things interesting. As of mid-2024, the dollar remains relatively strong compared to historical levels but faces ongoing challenges. It’s like watching a seasoned athlete still in the game but facing new hurdles and mounting injury woes. Has the USD past its prime?
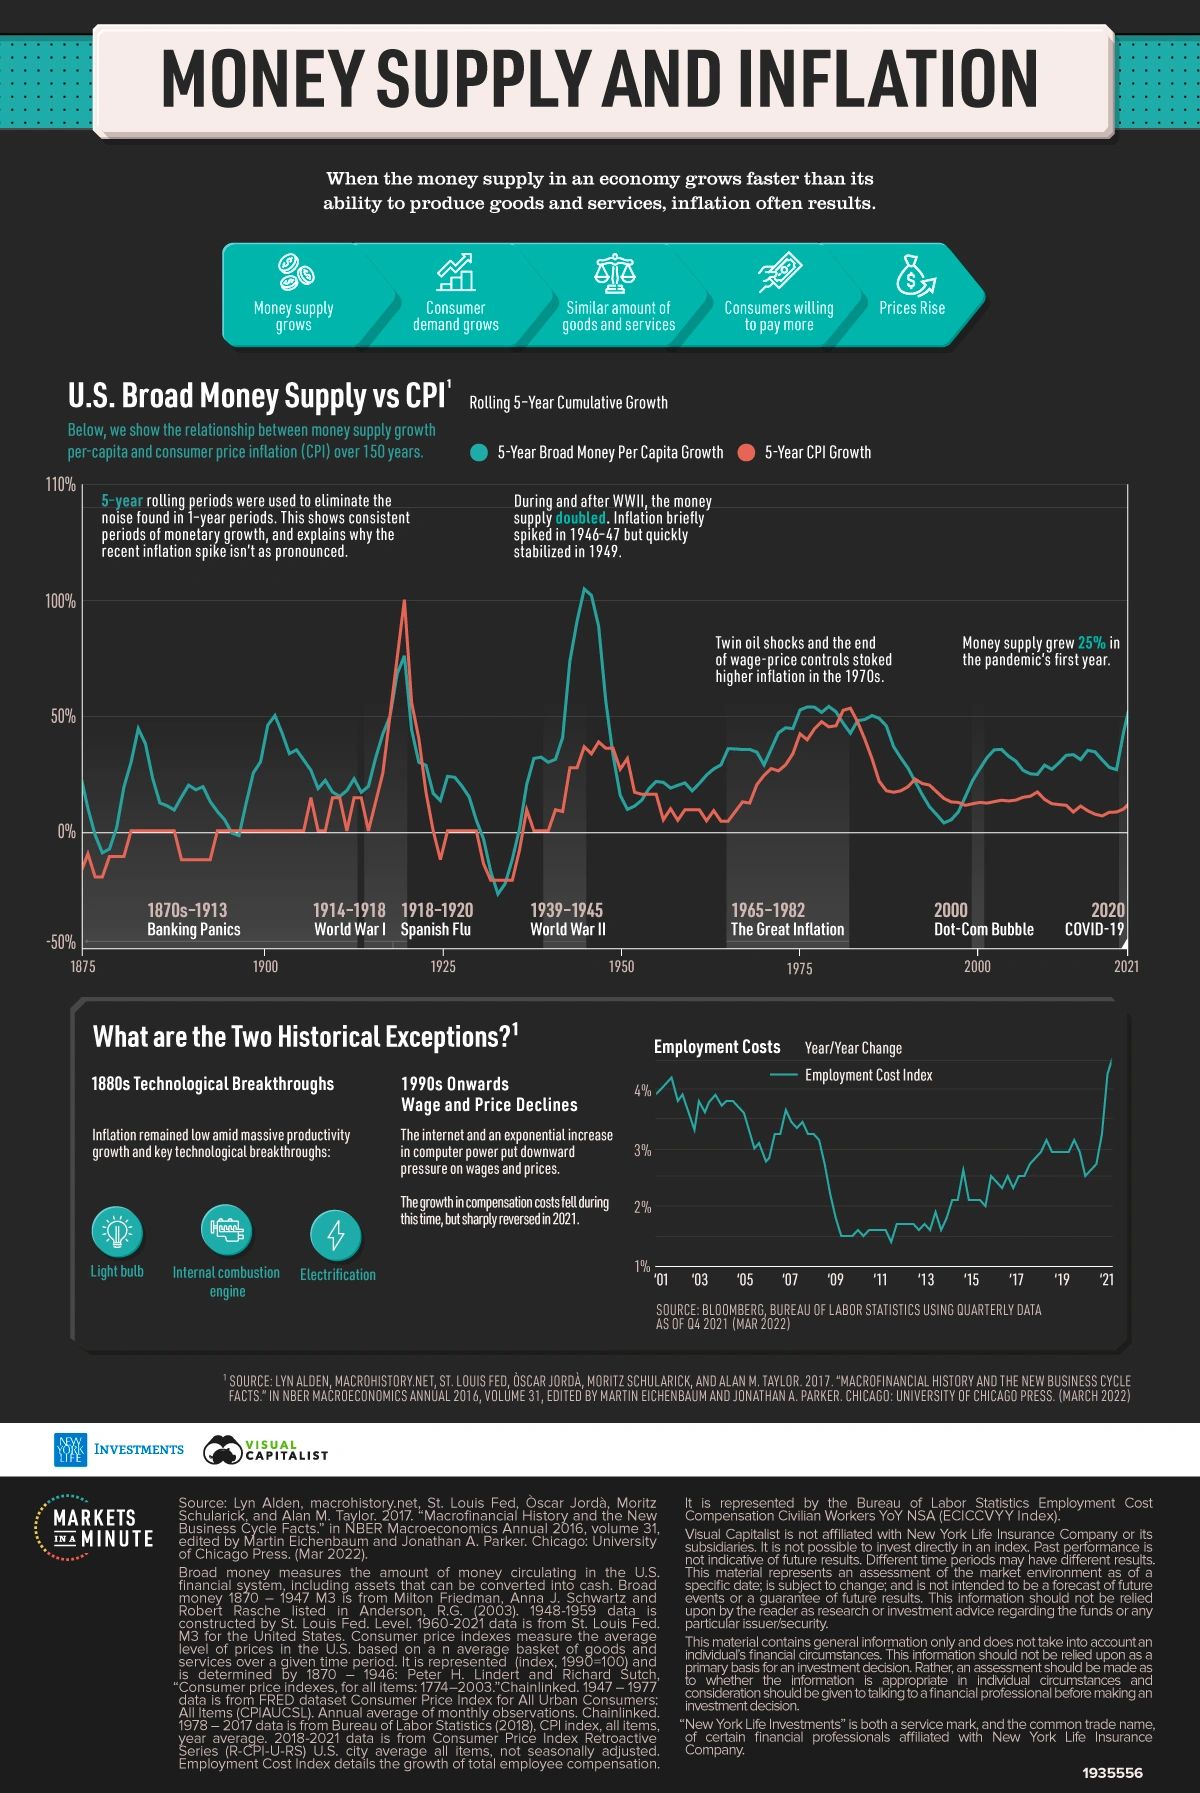
Defining Money Supply and Inflation
- Broad money supply – measures the amount of money circulating in the U.S. financial system, including assets that can be converted into cash.
- Inflation – measured by the consumer price index (CPI), inflation is the average level of prices in the U.S. based on a basket of goods and services over a given time period.
When more capital is injected into the economy, it can cause consumer demand to grow. Assuming a similar amount of goods and services available, consumers are willing to pay more–which leads to rising prices.
Money Supply and Inflation Over History
Here are the key periods where money supply per capita was the highest in recent history.
Five-year rolling periods were used to eliminate the noise found in one-year periods. As a result, this shows consistent periods of monetary growth, and explains why the recent inflation spike isn’t as pronounced.
As seen in the table below, there were five periods where broad money per capita growth exceeded 50%.
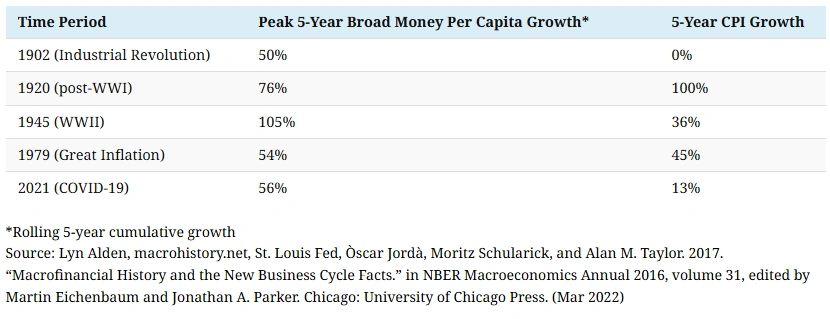
During WWII, the money supply doubled to finance war efforts. Inflation was high during and after this time, particularly in 1946-47, but returned to stability in 1949.
Amid soaring government deficits in the 1970s, inflation climbed upwards. In response the U.S. abandoned the monetary system established in WWII, decoupling from the gold standard, adopting the one we use today.
Today, while money supply per capita has grown 56%, inflation has increased, albeit at a muted rate compared to other periods. In addition, it’s been just two years since the money supply grew at such rapid rates. How inflation will play out in the future remains to be seen, although the FED along with many other governing fiscal bodies from other countries are all trying to get to that magic inflation number.
Two Historical Exceptions
There are two exceptions where inflation didn’t rise as sharply when the money supply increased.
Between 1875 and 1910, the U.S. emerged as a superpower. During this time, several technological innovations took place including the lightbulb, electrification, and the internal combustion engine. With the Spindletop oilfield advancements in 1901, more oil was produced there in one day than in all global oil fields combined.
As a result, this created real growth and vast improvements in productivity rather than inflation.
The second time period is from the 1990s onwards, with the advent of the internet. As computing power and automation improved, it led to productivity gains and deflationary pressures. As seen in the employment cost index, wage growth decreased amid globalization. Despite influxes of money supply, inflation remained low for decades.
Factors Influencing Dollar Devaluation
Several key factors have played a role in the devaluation of the U.S. Dollar over the past 15 years as we can see from above:
- Monetary Policy: The Federal Reserve’s interest rate decisions and QE programs have been like the puppet masters behind the dollar’s movements.
- Global Economic Conditions: The economic performance and stability of other major economies have influenced the demand for the dollar.
- Geopolitical Events: Trade wars, Brexit, and the COVID-19 pandemic have driven demand for safe-haven assets, including the dollar.
- Inflation: Persistent inflation has been the thorn in the dollar’s side, eroding its purchasing power and leading to devaluation concerns.
The U.S. dollar’s journey over the past 15 years has been nothing short of a blockbuster movie, filled with highs, lows, and plenty of drama. Despite facing periods of devaluation, it still remains a cornerstone of the global financial system. Understanding these dynamics is crucial for policymakers, investors, and anyone interested in the global economy. But the big question is how much longer can the US keep up the charade? The cracks are beginning to show, and the US dollar is becoming a less attractive financial asset in international trade, how much longer will it remain that cornerstone…. time will tell.

The Devaluation of the US Dollar
As we have seen over the past 15 years, the US dollar has experienced significant fluctuations, influenced by various economic, political, and global factors. The US dollar index (DXY), which measures the value of the dollar against a basket of six major currencies, has seen notable changes since 2009. The index peaked in 2016 but has generally trended downward since then. Several major factors have contributed to this devaluation:
Quantitative Easing (QE): The Federal Reserve’s QE programs, initiated in response to the 2008 financial crisis, increased the money supply, leading to a weaker dollar.
Interest Rate Policies: Lower interest rates in the US compared to other countries have made the dollar less attractive to investors.
Trade Deficits: Persistent trade deficits have also exerted downward pressure on the dollar.
Geopolitical Uncertainty: Political instability and trade tensions, particularly with China, have further weakened the dollar.
It’s no coincidence that the story of BTC begins in 2008, the same year the GFC occurred….
On the 18th of August 2008, the domain name bitcoin.org was registered. Later that year, on 31 October, a link to a paper authored by Satoshi Nakamoto titled Bitcoin: A Peer-to-Peer Electronic Cash System was posted to a cryptography mailing list. This paper detailed methods of using a peer-to-peer network to generate what was described as “a system for electronic transactions without relying on trust”. On 3 January 2009, the bitcoin network came into existence with Satoshi Nakamoto mining the genesis block of bitcoin (block number 0), which had a reward of 50 bitcoins. Embedded in the genesis block was the text:
The Times 03/Jan/2009 Chancellor on brink of second bailout for banks

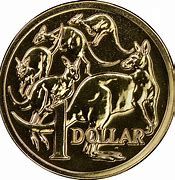
Impact on the Australian Dollar
The devaluation of the US dollar has had a mixed impact on the Australian dollar (AUD). Key effects include:
Exchange Rate Fluctuations: The AUD has appreciated against the US dollar during periods of dollar weakness. For instance, the AUD reached parity with the USD in 2011.
Commodity Prices: As a major exporter of commodities, Australia’s economy is sensitive to global commodity prices, which are often denominated in USD. A weaker dollar can lead to higher commodity prices, benefiting Australian exporters.
Interest Rate Differentials: Differences in interest rates between the US and Australia have influenced capital flows and exchange rates. Lower US rates have sometimes led to a stronger AUD.
The Aussie Dollar ranks 5th in the most traded currencies around the world. Although this is the case its performance against the USD over the past 10 years is less than impressive. As the US has printed more currency so has the AUS government and this has lead to a continual devaluation of the dollar. Despite reaching parity in 2011 it would appear that those days are well behind us and unlikely to return in the near future, unless Aussie financial policies change swiftly.
It’s no secret that our AUD buys us less today than 10 -15 years ago thanks to the fiscal policy of not only Australia but world governments. Keeping your dollar bills (or coins in AUS) under your mattress certainly does not look like a smart way to invest and store your cash and for that matter neither does it look too attractive to store it in the bank either (although it may be safer than storing it in your home under a mattress). The point is that over time our dollar buys us less, how much was a coffee 15 years ago, how much was Fuel for the car, how much was a litre of milk of a loaf of bread 15 years ago? The fact is that over that time our dollar has devalued and now buys us less thanks to the wonder of inflation. How much BTC could you have bought with a dollar 15 years ago?
Determinants of the Australian Dollar Over Recent Years | Bulletin – March 2021 | RBA
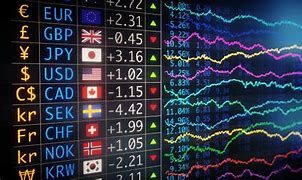
Broader Implications for Global Markets
The devaluation of the US dollar has far-reaching implications for global markets:
- Trade and Investment: A weaker dollar makes US exports cheaper and imports more expensive, affecting trade balances globally. It also influences investment flows, as investors seek higher returns in other currencies.
- Emerging Markets: Many emerging markets have debt denominated in USD. A weaker dollar can ease debt burdens, but it can also lead to inflationary pressures if local currencies depreciate.
- Commodity Prices: Since many commodities are priced in USD, a weaker dollar can lead to higher prices, impacting global inflation and economic stability.
- De-dollarization: The trend of de-dollarization, where countries reduce their reliance on the USD for international trade, has gained momentum. This shift could reshape global financial dynamics and reduce the dollar’s dominance.
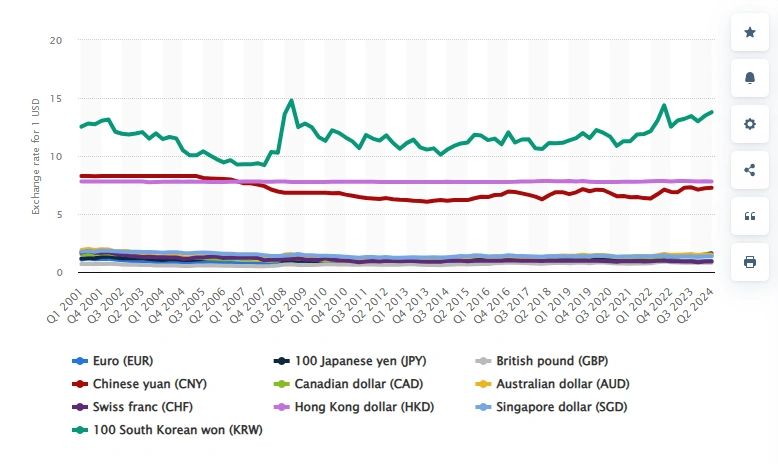
Most currencies have performed rather underwhelmingly vs the USD over the past 15 years apart from a few Asian currencies that have held up well vs the USD. The HKD has held a steady line, the Chinese Yaun has performed relatively strongly, and the South Korean Won has performed the strongest of these major currencies shown. There is a growing push toward de-dollarization especially by BRICS nations.
De-dollarization refers to the process of reducing the dominance of the U.S. dollar (USD) in global markets. Here’s how it works:
Historical Context:
- For centuries, various reserve currencies facilitated international transactions. These included currencies backed by European colonial powers like Spain, France, and England.
- After World War II, the Bretton Woods Agreement established the USD as the world’s primary reserve currency, replacing the British pound.
- In 1971, President Richard Nixon abandoned the gold standard, and the USD became backed solely by the U.S. government’s credit.
Current Situation:
- The USD remains the chief reserve currency and is widely used for international trade, foreign exchange reserves, and bilateral agreements.
- However, the de-dollarization movement has gained momentum. Countries like Russie, India, China, Brazil, Malaysia, and Bolivia seek alternatives to the USD. These are called BRICS nations – I have covered this off in previous blogs.
- They aim to set up trade channels using other currencies, reducing reliance on the almighty USD, and this is already occurring in an effort to undermine and destabilize the USD.
Implications:
- If de-dollarization continues, it could reshape global finance and trade.
- The USD’s reserve status might be challenged, impacting financial markets and economic dynamics.
- Diversifying currency holdings and encouraging other currencies in cross-border transactions are part of this trend.
What’s Next 2022 to now?
The war in Ukraine has led everything from nickel to wheat and food staples to rise in price. Supply chain disruptions are also fueling higher inflation. Whether or not today’s inflation echoes the price shocks of the 1970s or supply shock of the 1940s (or both) is an open question. At the same time, the Fed ended its net purchases of Treasuries and mortgage-backed securities in March 2022 amid elevated inflation. These emergency measures were used to support the economy during COVID-19. Overall, they totaled $4.6 trillion and the Federal Reserve’s balance sheet doubled over two years.
Going forward, the Fed planned to significantly reduce its balance sheet and raise interest rates. Economists predicted inflation would continue to rise in 2022, but long-term forecasts at the time suggested they may fall near the Federal Reserve’s 2% goal. The United States Federal Reserve recently left the fed funds target range unchanged at 5.25%-5.50% for the seventh consecutive meeting in June 2024. Policymakers are cautious about reducing rates until they gain greater confidence that inflation is sustainably moving toward the 2% target. The dot plot indicates only one rate cut this year and four reductions in 2025. Meanwhile, GDP growth projections remain steady, with the economy expected to expand 2.1% in 2024 and 2% in 2025 and 2026. Core PCE inflation is projected at 2.8% in 2024 and 2.3% in 2025.
So, when will the FED’s magical 2% figure be reached?
Federal Reserve Chair Jerome Powell recently indicated that the central bank won’t wait until inflation hits 2% to cut interest rates. Instead, they’re looking for “greater confidence” that inflation will return to the 2% level. While there’s no specific date, some analysts expect the Fed to start cutting rates beginning with the Federal Open Market Committee’s September 2024 meeting, as inflation falls back to its target and economic growth becomes a top concern, keep your eyes and ears peeled for their announcement after their end of July meeting…. But don’t be hoping for any crazy rate cuts any time soon. ‘Left to its own devices without shocks, how fast does inflation move to 2%?’ Cleveland Fed economist Randal Verbrugge asks. ‘Not very fast.’
Officials at the Federal Reserve are expecting inflation to keep easing over the next two years and have penciled in a return to their 2% target in 2026. But a senior research economist at the central bank’s Cleveland branch, Randal Verbrugge, is warning that it could actually take several years to reach that target – a level designated by the interest-rate-setting Federal Open Market Committee as consistent with maximum employment and price stability. That’s because of what he calls intrinsic characteristics of inflation that make it unlikely to get to 2% in a timely way. The model he came up with shows inflation will still be above target, at 2.7%, by the second quarter of 2025 and close to, but slightly above, 2% as of mid-2027. The US presidential race will have a profound effect on the fiscal policy of the US and just how the economy reacts and responds is all dependent on who gets in that chair in the oval office.
The devaluation of the US dollar over the past 15 years has had significant effects on the Australian dollar and global markets. While it has created opportunities for some, it has also introduced challenges and uncertainties. As the global economy continues to evolve, the interplay between major currencies will remain a critical factor in shaping economic outcomes worldwide. How will crypto shape this and where does BTC and the wider crypto market fit into this?

How Cryptocurrencies Affect Dollar Devaluation
The relationship between cryptocurrencies and the U.S. dollar is like a roller coaster ride, full of twists and turns. As digital currencies have gained prominence, their impact on traditional fiat currencies, particularly the U.S. dollar, becomes increasingly significant. Along with Federal policy and the general action of the US government and its influence on the other global governments these all have implications on the play between Fiat currency and Cryptocurrency.
Hedge Against Inflation: Cryptocurrencies like Bitcoin are often seen as a hedge against inflation. Unlike fiat currencies, which can be printed in unlimited quantities, Bitcoin has a fixed supply of 21 million coins. This scarcity can make it an attractive store of value during times of inflation, potentially reducing reliance on the dollar. Think of Bitcoin as the digital gold that almost everyone wants to get their hands on!
Alternative Investment: As more investors seek alternatives to traditional assets, cryptocurrencies provide a new avenue for investment. This shift can reduce demand for the dollar, especially if investors perceive cryptocurrencies as a safer or more profitable option, and an option that if invested wisely can prove to be extremely beneficial over time. This can be seen in the rise of ETF’s and their growing popularity. Evidence of this is in the BTC ETF’s earlier this year and now the imminent launch of ETH ETF’s.
Decentralization and Trust: Cryptocurrencies operate on decentralized networks, which can appeal to those wary of centralized financial systems. This decentralization can lead to a gradual shift away from the dollar as the primary global reserve currency. Imagine a world where financial power is in the hands of the people, not just a few institutions. This was the dream of Satoshi Nakomoto and is the reality of blockchain.
Global Transactions: Cryptocurrencies facilitate cross-border transactions without the need for currency conversion, reducing the dominance of the dollar in international trade. This can contribute to a gradual devaluation of the dollar as global reliance on it decreases. We will likely see this play out more in the years to come as cryptocurrencies rise further in popularity.
Ethereum ETF Frenzy Ignites Market: ETH Skyrockets to $3,499! (msn.com)

Effects of Dollar Devaluation on Cryptocurrencies
Increased Demand for Crypto: When the dollar devalues, people often seek assets that can preserve their wealth. Cryptocurrencies, with their limited supply and decentralized nature, can become more attractive, leading to increased demand and potentially higher prices. In the peak of the Bullrun it’s like a mad rush to grab the treats falling from a pinata at a child’s party!
Inflation Hedge: A weaker dollar can lead to higher inflation rates. Cryptocurrencies, particularly Bitcoin, are often viewed as a hedge against inflation. As the dollar loses value, more investors might turn to certain cryptocurrencies to protect their purchasing power. Think of it as putting your money in a safe that inflation can’t break into. Sure, the value of BTC can rise and fall but if you take a look at the general trend over its history you will see that it is the best performing asset class by far! (although if I had made the graphic it would have said 10 year returns – I really should have made my own….)
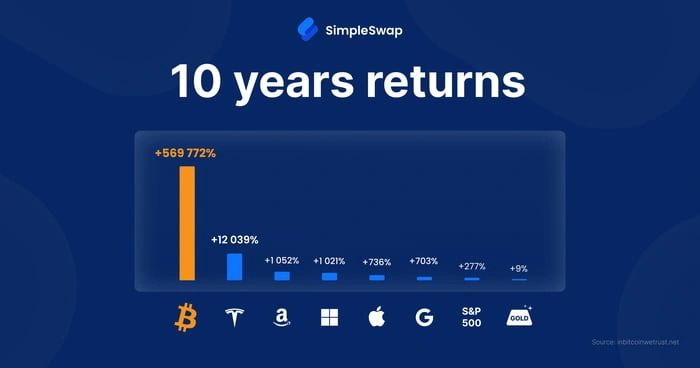
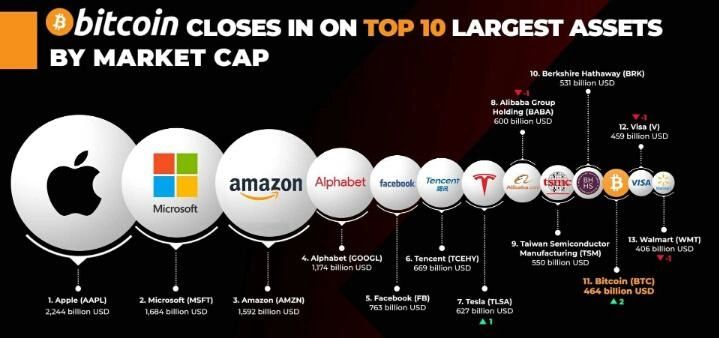
Market Volatility: Dollar devaluation can lead to increased volatility in financial markets. Cryptocurrencies, known for their volatility, might experience even greater price swings as investors react to changes in the dollar’s value. At times especially during a lead up to a Bull Run it’s like riding a wild bull in the financial rodeo! This is where you need to know when to hold em and when to fold em and using a stable coin like USDT to swap to is a great way to preserve your savings and then buy back in when the market gets toward the bottom of the dip. But always do your homework and seek your own independent financial advice or you may end up like these people….
Shift in Global Financial Dynamics: A significant devaluation of the dollar could accelerate the adoption of cryptocurrencies as alternative global currencies. This shift could lead to a more diversified and decentralized global financial system, reducing the dollar’s dominance. Imagine a world where financial power is more evenly distributed. I am not sure if we will ever see that day but for now let’s just keep on accumulating our crypto – keep on mining and keep on accumulating wisely.
The interplay between cryptocurrencies and the U.S. Dollar is shaping the future of global finance. As technology evolves within the blockchain sector and the use of cryptocurrencies in various facets of society grows cryptocurrencies continue to gain traction, their impact on the dollar’s value becomes more pronounced. Conversely, fluctuations in the dollar’s value can significantly influence the crypto market. Understanding this dynamic is crucial for investors and policymakers navigating the evolving financial landscape.
There is no doubt that we can see how much crypto in general especially some of the main coins such as BTC, ETH, LTC, Doge, SOL, BNB, TON and ADA, as well as others such as ETC, KAS and CKB and more… with year on year returns of 36-648%. When choosing the best cryptocurrency to mine or invest in, it is important to consider your individual goals, investing timeline and risk profile, just as you would with any investment. Additionally, you should do your due diligence to make sure that any crypto project you are interested in is legitimate and secure.
So, if you haven’t already, are you ready to embrace the exciting world of cryptocurrencies and witness the transformation of traditional currencies? It’s time to start mining, time to start investing. The future is bright, and the possibilities are endless, what are you waiting for? 🚀



Disclaimer: The content on this site and in this communication should not be considered investment or financial advice. Any investing or crypto mining is speculative. When investing your capital is at risk, please do your own research and invest and make your decisions wisely. Mining profits are not guaranteed and may vary over time depending on the market performance and network hashrates.