ETH ETF’s Christmas in July – July markets review


Both the traditional and crypto markets exhibited a combination of policy-driven stability and increased risk appetite in July. Mainstream equities surged on strong earnings and easing rate fears. The S&P 500 and Nasdaq achieved record highs, although globally gold and real estate declined. In crypto, ETH saw significant growth, signaling a new phase of institutional integration. Let’s dig in to the July Markets Review and July Crypto Review.
July marked a record-breaking month for spot ETH ETFs, which attracted over $5.4 billion in net inflows, greater than in all previous months combined since their launch. The monthly ETH ETF inflow growth was 366%, significantly higher than BTC ETFs’ 33%.
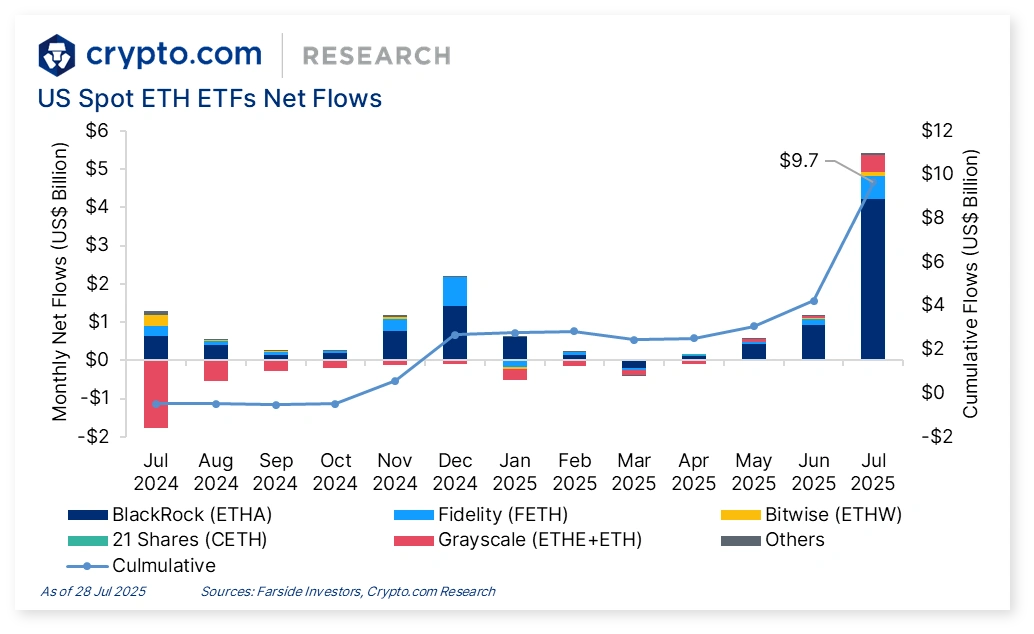
ETH ETF’s enjoyed Christmas in July and has shown renewed and revived interest in Ethereum, there is certainly a new momentum and confidence with Ethereum currently which has been long overdue. ETH gained prominence as a treasury asset, with net inflows into spot ETFs signaling a shift in investor preference. Assisted by regulatory developments, particularly in the US with the GENIUS Act, aimed to regulate stablecoins and promote crypto investment in retirement accounts.
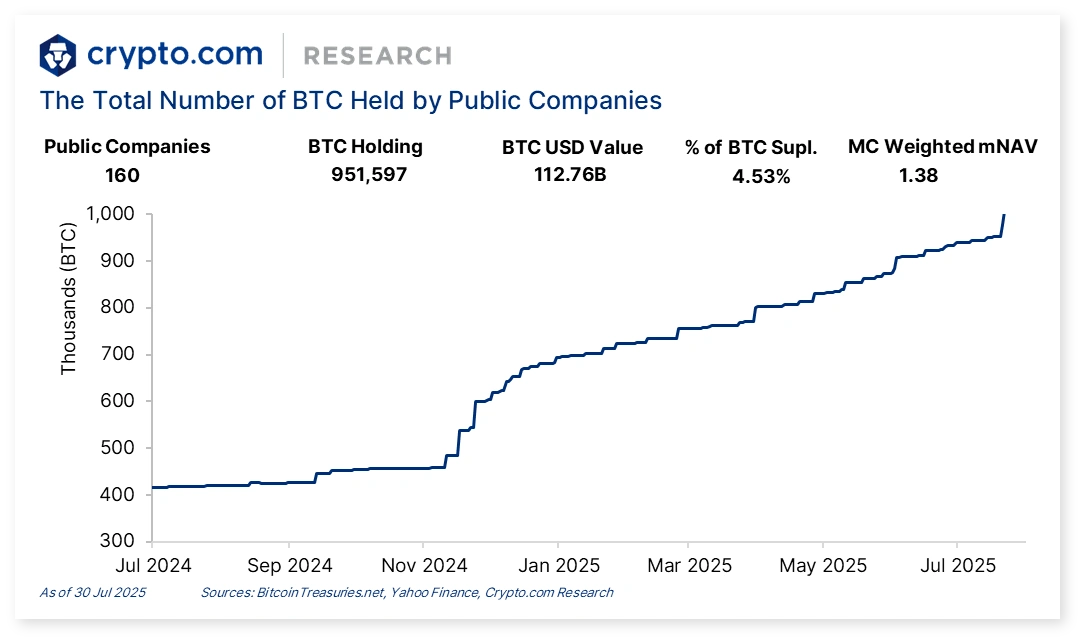
The surge in ETH demand stemmed from growing institutional adoption, the appeal of staking yields, and a wave of companies adding ETH to their reserves — a phenomenon seen as a ‘productive capital’ evolution for corporate treasuries. Additionally, BTC adoption as treasuries for public companies accelerated. Over 951,000 BTC were reserved by the publicly listed organisations, accounting for 4.5% of the total BTC supply.
Bridgewater Associates founder Ray Dalio recommended that investors allocate 15% of their portfolios to BTC or gold. This is a significant increase from his 2022 recommendation of 1 to 2% in BTC. The return of the constructed portfolio with 5% exposure to BTC and ETH indicated a 2% return compared to a 0.7% return with a traditional portfolio.
Looking ahead, BTC volatility may increase, while ETH’s role as a treasury asset is expected to grow, supported by corporate capital migration and favourable regulatory frameworks. Overall, the environment suggests continued evolution and integration of crypto within traditional finance.

The G20 macroeconomic landscape showed slowing growth and persistent inflation, with India and China leading growth amid stagnation in advanced economies. Central banks are cautiously easing policies, navigating geopolitical tensions and trade uncertainties.
The equity markets in the US hit multiple record highs, driven by strong corporate earnings, AI enthusiasm, and stable Fed policies. European markets maintained near-record levels, while Asian markets showed mixed results, with China and Japan advancing, but India facing setbacks due to tariffs.

The S&P 500 gained 3.1% in July, buoyed by:
- Stronger-than-expected Q2 earnings, showing healthy growth across sectors, not just mega-cap tech.
- Progress in international trade: The US finalised trade agreements with Japan, Indonesia, and the Philippines.
- Ongoing talks with the EU to avoid a 30% tariff on European goods, with a deadline set for August 1.
In July, the US inked key trade deals with Asian nations and advanced negotiations with the EU, giving investors confidence and contributing to broad market gains in US stocks.
The US stock market delivered a standout month in July, with major indices vaulting to a series of fresh record highs and investor risk appetite remaining notably robust.
- The S&P 500 logged its sixth consecutive record close by the final week of July, marking its 15th record close of the year.
- The Nasdaq Composite accelerated past the 21,000 mark, propelled by surging technology stocks and ongoing investor enthusiasm for artificial intelligence (AI).
- The Dow Jones Industrial Average also posted gains, but continued to trail the tech-heavy indices.
US equity markets set multiple record highs in July, with both the S&P 500 and Nasdaq posting their longest streaks of record closing peaks for the year. During the last week of July, the S&P 500 achieved its 15th record of the year, closing at 6,339 by the end of July with 2.28% growth in the month.
The Nasdaq Composite also advanced to fresh highs, at times crossing the 21,122, growing by 4.55%. While the Dow Jones Industrial Average has lagged somewhat, it also posted gains around 0.08%.
Key Drivers of US Stock Market in July include:
- Strong Corporate Earnings: Robust Q2 earnings season was a major support. Over 80% of reporting S&P 500 companies topped Wall Street estimates, especially in the technology sector.
- AI and Technology Optimism: Persistent optimism around AI applications and productivity gains kept technology stocks at the forefront. The Information Technology, Industrials, and Communication Services sectors were standout performers for the month.
- Easing Geopolitical and Trade Uncertainty: Markets were buoyed by easing global trade tensions, especially a provisional US-China trade agreement and other finalised tariffs agreements including EU and Japan.
- Stable Fed Policy and Macro Trends: The Fed maintained steady policy rates, reinforcing expectations of continued low interest rates and giving investors confidence amid cooling inflation and a resilient US labor market.
- Sector Rotation: July saw notable sector rotation, as cyclical names (e.g., Industrials, Financials) joined technology in the rally. Utilities also gained ground, supported by expectations of rising electricity demand from AI data centers. Meanwhile, healthcare and consumer discretionary sectors underperformed.
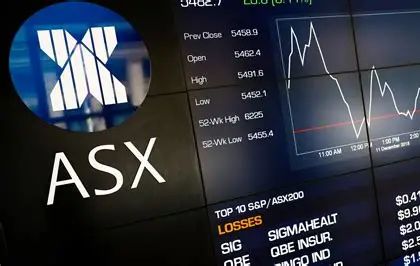
The ASX 200 rose 1.5%, supported by:
- Steady RBA policy: The Reserve Bank of Australia held the cash rate at 3.85%, but hopes for future rate cuts remain high as inflation data looms.
- Mining rally: Rising iron ore prices drove major miners higher:
- BHP and Rio Tinto climbed around 10%.
- Fortescue Metals Group rose 20%.
Iron ore prices increased sharply, benefiting resource-heavy companies like BHP, Rio Tinto, and Fortescue, lifting the broader ASX 200 index. I personally finished last financial year up over 39% across all my stocks but had a few underperformers in July. However, still finished up over 33% at month end. With a bulk of exposure in key ASX 200 and 300 companies and some key US stocks, some key US and ASX ETF’s, with smaller exposure to wider global markets as well as some lesser-known home grown performers it has helped to recover some of the more speculative assets that in some cases have very much underperformed.

Europe’s STOXX 600 index climbed 1.6%, driven by:
- Trade optimism: US-EU talks appeared to be heading toward a positive resolution.
- Strong economic data: The Eurozone economy grew faster than expected.
- Monetary stability: The European Central Bank held interest rates steady, as inflation approached the 2% target and GDP met expectations.
July data showed accelerated growth across the region, boosting market confidence and supporting central bank policy stability.

China’s Shanghai Composite Index surged 4.1% due to:
- Tariff truce hopes: Optimism rose ahead of a fresh round of US-China trade talks in Stockholm.
- Earlier talks in London (June) and May helped lift prior restrictions and introduced a 90-day pause in new tariffs.
- Growing signs of US-China cooperation following months of decoupling concerns.
While US trade tensions persist, July saw meaningful dialogue that suggests a more collaborative path forward, reassuring investors and the resultant performance of the market reflects this for July. Let’s hope that further solutions emerge to steady the market and bring about more certainty and free flow of cash in the coming months.

Japan’s Nikkei 225 rose 1.7%, supported by:
- New trade deal with the US, capping most tariffs at 15%, avoiding earlier 25% threats on autos.
- Inflation slowdown: July CPI eased to 2.9% YoY, down from 3.1% in June and slightly under expectations.
Japan’s economy is not too dissimilar to that of Aus or the US with a high degree of focus on interest rates. Despite easing inflation, it remains above the Bank of Japan’s 2% target, and reduced trade risks may open the door for another rate hike later this year.

Which global market performed the best in July 2025?
China’s Shanghai Composite led with a 4.1% monthly gain, driven by improving trade sentiment and tariff pause extensions.
Is now a good time to invest in global equities?
While past performance doesn’t guarantee future returns, positive earnings, easing trade tensions, and central bank stability in July painted an optimistic outlook for diversified equity investors, so it may be a good time to examine a few global options, my only reservation is the remaining global geopolitical tensions.

So…. What about Crypto?
July began with Bitcoin navigating tariff-related uncertainty, fluctuating in the $105,000–$110,000 USD range during the first week as managers monitored deadline extensions. By week two, a 9.04% rally pushed it past $120,000 USD, aligning with ETF inflows and on-chain buying absorption that encouraged investors lean into core holdings. Consolidation followed in weeks three and four, with prices settling around $117,000 USD —a net 8% monthly gain—prompting a shift toward protective measures like higher stablecoin allocations to buffer volatility.
Ethereum’s narrative was one of steady outperformance, climbing 17.3% to $3,800 USD and testing $4,000 USD resistance, driven by ecosystem rotations and staking rates hitting 29.4% of supply. This strength led asset managers on our platform to boost ETH-linked exposures, capitalizing on correlations with DeFi (0.77) and RWAs (0.98). Altcoins mirrored this, with volumes spiking 42.86% in week two and 48.23% in week three before easing 8.12% to $1.323 trillion in week four, as rotations favored compliance tokens like XRP and HBAR post-CLARITY Act.
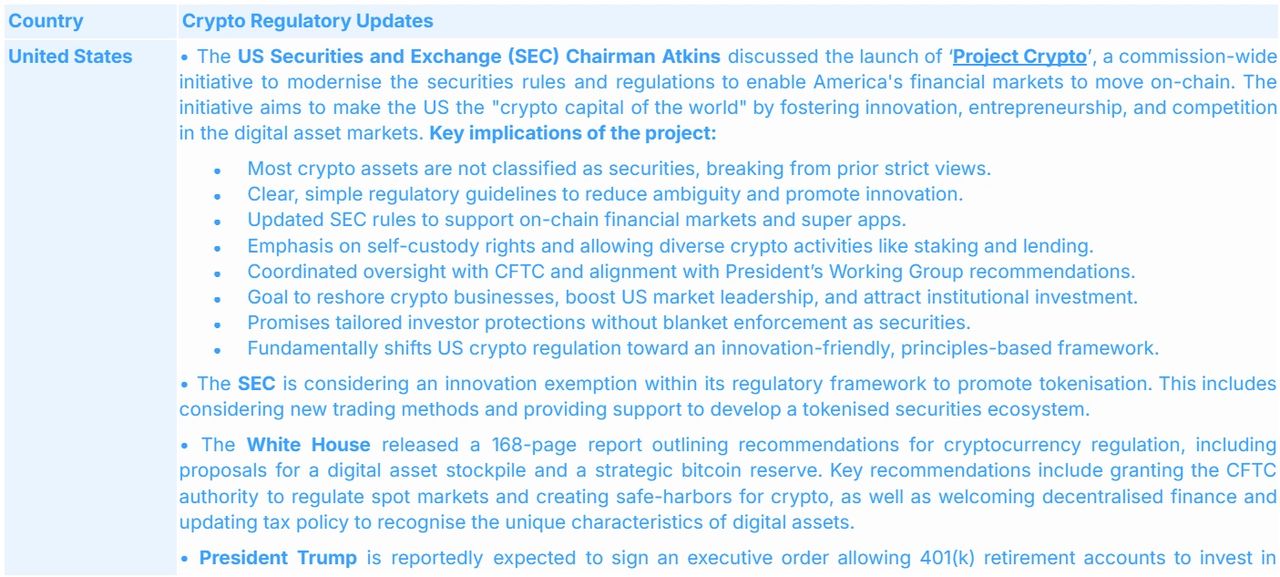
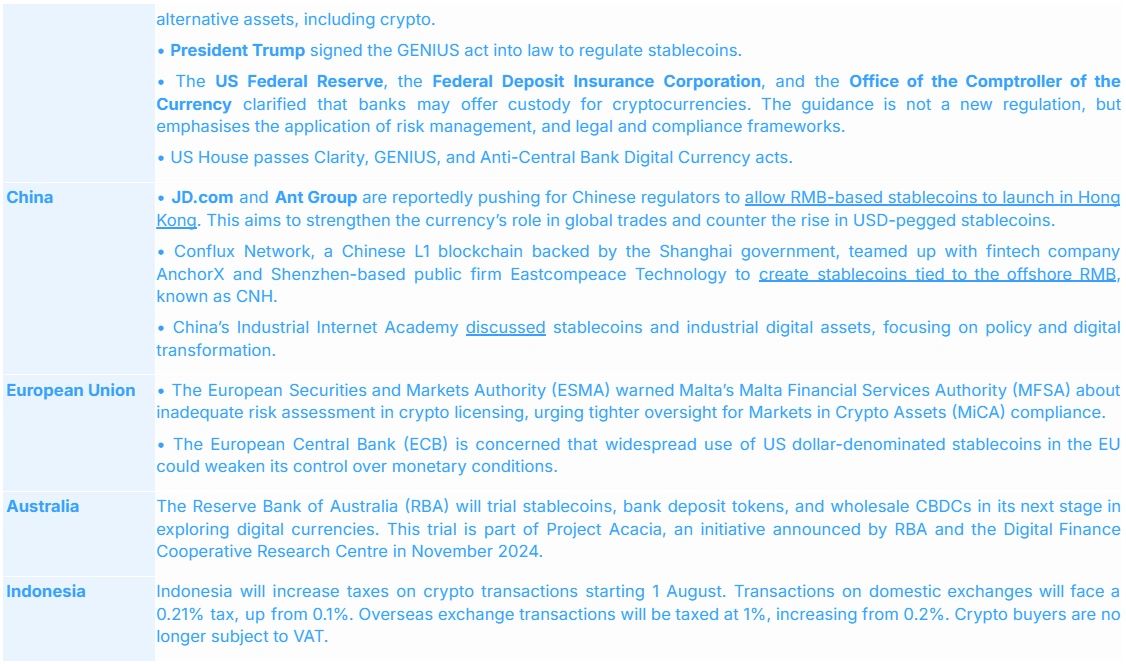
Overall capitalization rose 13.2% to $3.85 trillion USD, with daily volumes averaging $161 billion USD (up 56%), and Bitcoin dominance dipping to 60.6% before a late 0.18% rebound. The Fear & Greed Index hovered at 70–75, sustaining optimism but dipping slightly by end-month, signaling managers’ cue to diversify. Data shows this prompted a 2% average increase in altcoin sleeves, as users sought yield amid dominance declines.
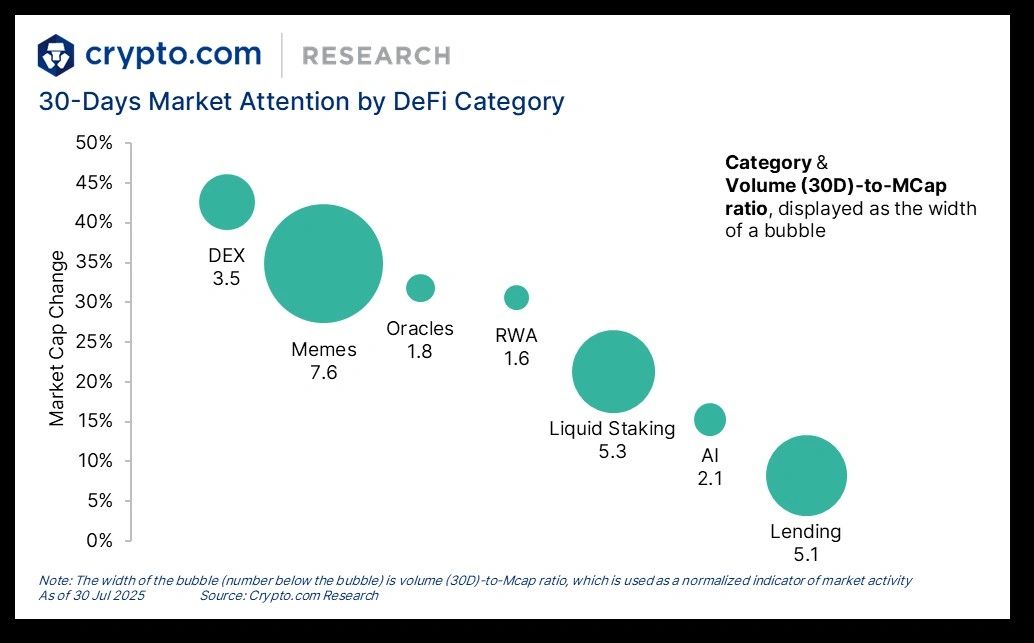
The Memecoin category is gaining attention with impressive market capitalisation growth and the highest trading activity relative to its market capitalisation. Previous institutional flows boosted Ethereum Layer-1 (L1) and its beta, suggested by the high participation in liquid staking and lending protocols coinciding with ETH’s bullrun.

Crypto Will Enter Retirement Market
President Trump is reportedly planning to sign an executive order allowing 401(k) retirement plans to invest in alternative assets, including cryptocurrencies like BTC gold, and private equity. This move aims to unlock the US$9 trillion US retirement market and is expected to benefit major private investment firms, directing federal regulators to remove barriers preventing 401(k) plans from including these non-traditional investments in managed funds.
Trump’s Plan To Pump The Market
Crypto Is Coming To 401(k)’s
The US retirement market has a defined-contribution (DC) base of $12 trillion USD and the Executive Order Trump signed means there will now be a constant background bid for crypto.
If even a small percentage of this gets reallocated into crypto, this will significantly impact the market.
- 1% portfolio allocation = $120 billion inflow
- 3% portfolio allocation = $360 billion inflow
- 5% portfolio allocation = $600 billion inflow
These flows may not come right away, given the infrastructure required. But when the flows start coming, the green candles will be beautiful.
Once this kicks into gear in the US we are bound to see further effects across the rest of the world and this includes more influence in Australian Superannuation Funds.

On-Chain Trends: Accumulation and Market Stability
Bitcoin’s on-chain data throughout July revealed key insights into crypto market trends, showing a shift from aggressive trading to accumulation. In week 3, transactions peaked at 736,600 BTC, then dropped by 50% to 367,000 BTC in week 4. This shift suggests a move towards long-term holding rather than speculative trading.
The support levels for Bitcoin established between $117k–$119k were reinforced by 665,000 BTC added during week 3. Meanwhile, profit-taking decreased from 300,000 BTC in week 3 to 150,000 BTC in week 4, indicating a shift to a more stable market environment.
Institutions remained bullish on Bitcoin, adding 60,107 BTC in week 4, while long-term holders sold a total of 150,000 BTC throughout the month. This institutional buying activity helped maintain a strong support structure.
Key On-Chain Signals:
- Bullish: Strong support at $117k suggests potential for Bitcoin to test $130k on favorable macros.
- Bearish: Profit-taking and distribution patterns signal possible dips to $105k–$108k.
- Neutral: Stable velocity supports altcoin rotations as Bitcoin dominance wanes.
Institutional Flows: Continued Growth in Crypto Asset Allocations
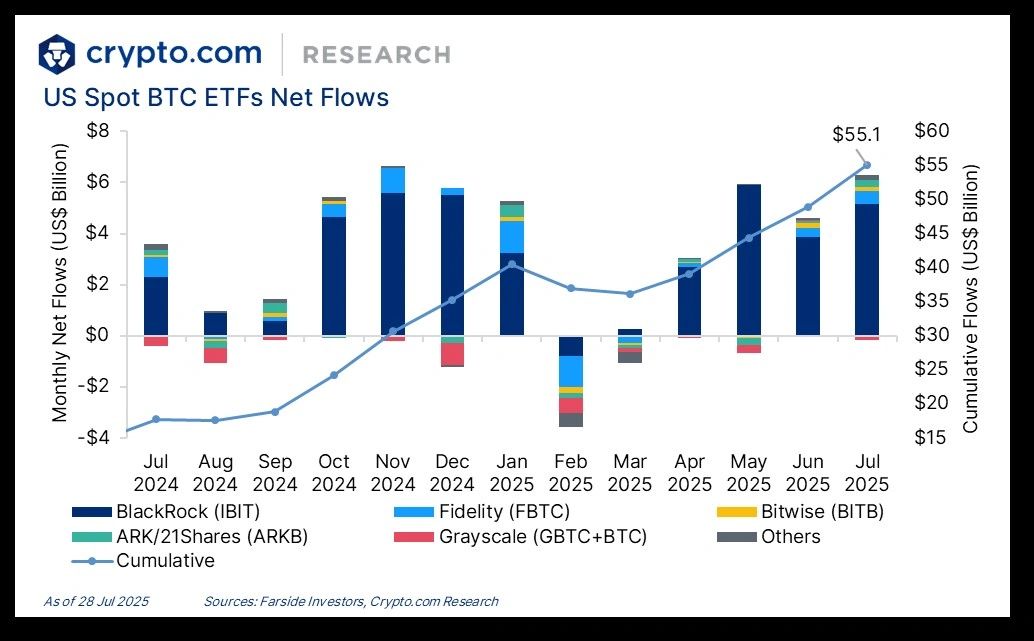
Institutional demand in July 2025 showed a clear trend of growing confidence in the crypto market. Bitcoin ETFs attracted $12.8 billion, with $6 billion allocated to Bitcoin and $5.43 billion to Ethereum. BlackRock captured 75% of the new inflows, increasing its assets under management to $84 billion.
Corporate treasuries also remained active, adding 60,107 BTC in week 4, bringing the total increase since April to 147,000 BTC. MicroStrategy continued its role as a key institutional player, reporting $10 billion in Q2 revenue from its Bitcoin holdings, signaling institutional commitment to Bitcoin as a reserve asset.
Expanding the DeFi Ecosystem: Institutional Adoption and Growth
The rise of DeFi in July 2025 was a significant trend, with institutional players embracing DeFi protocols for yield generation. Ethereum’s 29.4% staking rate played a crucial role in driving DeFi growth. As compliance tokens gained popularity, institutional investors were attracted to DeFi projects that fit into a regulated framework, such as those stemming from the CLARITY Act.
Many asset managers increased their DeFi exposure within their portfolios, capitalizing on yield-generating opportunities from Ethereum-based projects. Additionally, tokenized assets, particularly Real-World Assets (RWAs), continued to gain traction, further bolstering the growth of DeFi platforms.

Regulatory and Macroeconomic Insights: Key Catalysts for Market Growth
Regulatory advancements and macroeconomic factors played a pivotal role in shaping crypto market trends in July 2025. Key legislative measures such as the CLARITY Act and GENIUS Act provided much-needed clarity, driving growth in compliance tokens and stablecoins while enhancing institutional confidence.
The CLARITY Act: Defining Digital Assets and Exempting DeFi
The CLARITY Act provided definitive classifications for digital assets, distinguishing between securities and commodities, which helped reduce regulatory ambiguity. This was particularly important for DeFi projects, which were exempted from certain securities regulations.
The GENIUS Act: Stablecoin Reserves and CBDC Ban
The GENIUS Act mandates stablecoin reserves, ensuring that these digital assets are fully backed by real-world assets, boosting their credibility and stability. The legislation also bans CBDCs (Central Bank Digital Currencies).

The Crypto Market Trends: Surge to Stabilization
July began with Bitcoin navigating tariff-related uncertainty, fluctuating in the $105,000–$110,000 range during the first week as managers monitored deadline extensions. By week two, a 9.04% rally pushed it past $120,000, aligning with ETF inflows and on-chain buying absorption that encouraged Finestel users to lean into core holdings. Consolidation followed in weeks three and four, with prices settling around $117,000—a net 8% monthly gain—prompting a shift toward protective measures like higher stablecoin allocations to buffer volatility.
Ethereum’s narrative was one of steady outperformance, climbing 17.3% to $3,800 and testing $4,000 resistance, driven by ecosystem rotations and staking rates hitting 29.4% of supply. This strength led asset managers on our platform to boost ETH-linked exposures, capitalizing on correlations with DeFi (0.77) and RWAs (0.98). Altcoins mirrored this, with volumes spiking 42.86% in week two and 48.23% in week three before easing 8.12% to $1.323 trillion in week four, as rotations favored compliance tokens like XRP and HBAR post-CLARITY Act.
Overall capitalization rose 13.2% to $3.85 trillion, with daily volumes averaging $161 billion (up 56%), and Bitcoin dominance dipping to 60.6% before a late 0.18% rebound. The Fear & Greed Index hovered at 70–75, sustaining optimism but dipping slightly by the end of the month.
Institutional Flows: Continued Growth in Crypto Asset Allocations
Institutional demand in July 2025 showed a clear trend of growing confidence in the crypto market. Bitcoin ETFs attracted $12.8 billion, with $6 billion allocated to Bitcoin and $5.43 billion to Ethereum. BlackRock captured 75% of the new inflows, increasing its assets under management to $84 billion.
Corporate treasuries also remained active, adding 60,107 BTC in week 4, bringing the total increase since April to 147,000 BTC. MicroStrategy continued its role as a key institutional player, reporting $10 billion in Q2 revenue from its Bitcoin holdings, signaling institutional commitment to Bitcoin as a reserve asset.

Expanding the DeFi Ecosystem: Institutional Adoption and Growth
The rise of DeFi in July 2025 was a significant trend, with institutional players embracing DeFi protocols for yield generation. Ethereum’s 29.4% staking rate played a crucial role in driving DeFi growth. As compliance tokens gained popularity, institutional investors were attracted to DeFi projects that fit into a regulated framework, such as those stemming from the CLARITY Act.
Many asset managers increased their DeFi exposure within their portfolios, capitalizing on yield-generating opportunities from Ethereum-based projects. Additionally, tokenized assets, particularly Real-World Assets (RWAs), continued to gain traction, further bolstering the growth of DeFi platforms.
The CLARITY Act: Defining Digital Assets and Exempting DeFi
The CLARITY Act provided definitive classifications for digital assets, distinguishing between securities and commodities, which helped reduce regulatory ambiguity. This was particularly important for DeFi projects, which were exempted from certain securities regulations. As a result, compliance tokens like XRP, HBAR, and ADA saw significant growth, benefiting from clearer regulatory standing. These tokens have experienced price increases of 20–45%, as institutional investors now feel more comfortable incorporating them into their portfolios.
The CLARITY Act has positioned these compliant assets as safer investments for institutional clients, leading to increased capital inflows from both hedge funds and family offices, who have been adjusting their allocations toward these more clearly regulated assets.
The GENIUS Act: Stablecoin Reserves and CBDC Ban
The GENIUS Act mandates stablecoin reserves, ensuring that these digital assets are fully backed by real-world assets, thus boosting their credibility and stability. The legislation also bans CBDCs (Central Bank Digital Currencies), reinforcing the role of private stablecoins in the broader crypto economy. This has been beneficial for stablecoins like USDC and Tether, which continue to grow as important tools for managing market volatility and hedging risk.
Moreover, the growth of Real-World Assets (RWAs)—which are projected to reach a market size of $16 trillion by 2030—has further contributed to the adoption of stablecoins and tokenized assets. The GENIUS Act’s introduction of stablecoin reserves is helping to legitimize the stablecoin market, making it an essential part of institutional portfolios.
Global Regulatory Efforts: Enhancing Market Confidence
Alongside these domestic measures, global regulatory efforts like the MiCA (Markets in Crypto-Assets) framework in the European Union and Hong Kong’s crypto licensing have added to the growing confidence in crypto assets. These regulations aim to standardize compliance across jurisdictions, providing institutional investors with clearer guidelines for operating within the crypto space.
These regulatory shifts have made it easier for asset managers to navigate the complex crypto market. In particular, the regulatory clarity surrounding DeFi and stablecoins has encouraged institutions to increase their exposure to compliant digital assets, further boosting market liquidity and participation.
Sector Trends: Rotation into Compliant Assets and DeFi
The rise of DeFi and tokenized assets has become a central and more prominent theme in crypto market trends. Ethereum remains the dominant player in DeFi, with staking and yield generation driving investor interest. As institutional confidence in compliance tokens like XRP and HBAR continues to grow, asset managers are shifting their focus toward these tokens for stable returns in the rapidly growing DeFi ecosystem.
Platforms like Robinhood and xStocks have emerged as popular choices for regulated trading, with xStocks offering DeFi integration, global flexibility, and opportunities for lending and mining. This trend highlights the growing preference for regulated platforms that can provide secure, compliant avenues for trading and investing in cryptocurrencies.

MVRV Z-Score Signals Institutional-Led Cycle
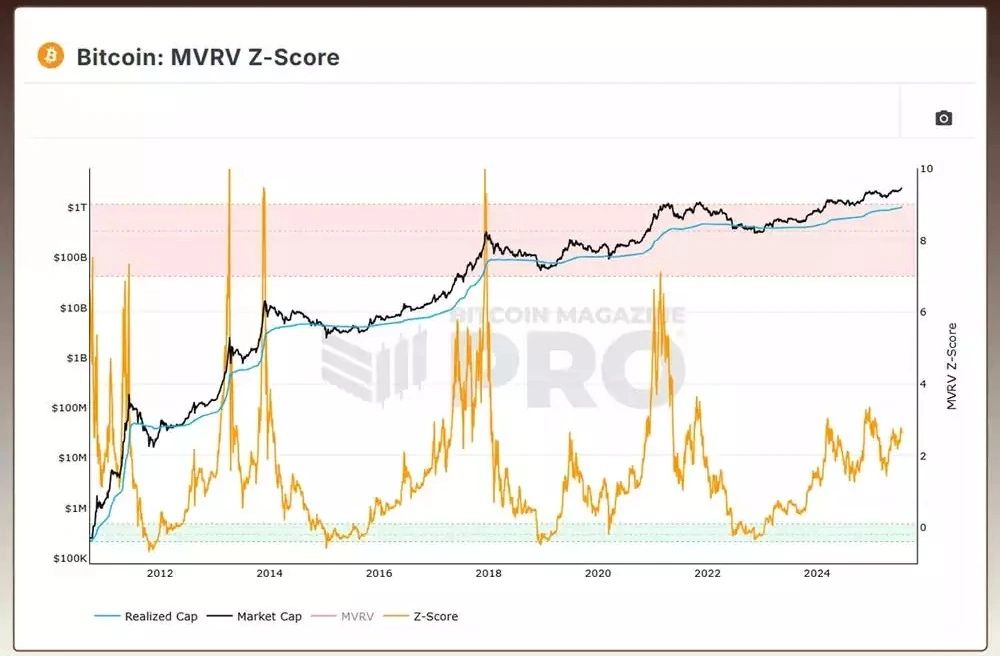
The MVRV Z-Score isn’t exhibiting the dramatic spikes seen in past bull markets. Instead, it remains relatively subdued—reflecting a broader observation that this cycle appears to be driven more by institutional capital than retail speculation.
In previous cycles, retail enthusiasm pushed the Z-Score into heavily overvalued territory. This time, the trend is far more controlled. The gradual, stepwise price appreciation has tracked alongside a steadily rising realised cap, helping to keep the Z-Score in check.
Rather than timing market tops, the MVRV Z-Score provides insight into the market’s underlying sentiment and capital structure. At present, it suggests restraint, not exuberance. With retail participation still limited—confirmed by multiple behavioural and flow metrics—the signal indicates further room to run before the market approaches overheated conditions.
Bitcoin Market Value to Realized Value
Sentiment Lags, Resilience Persists
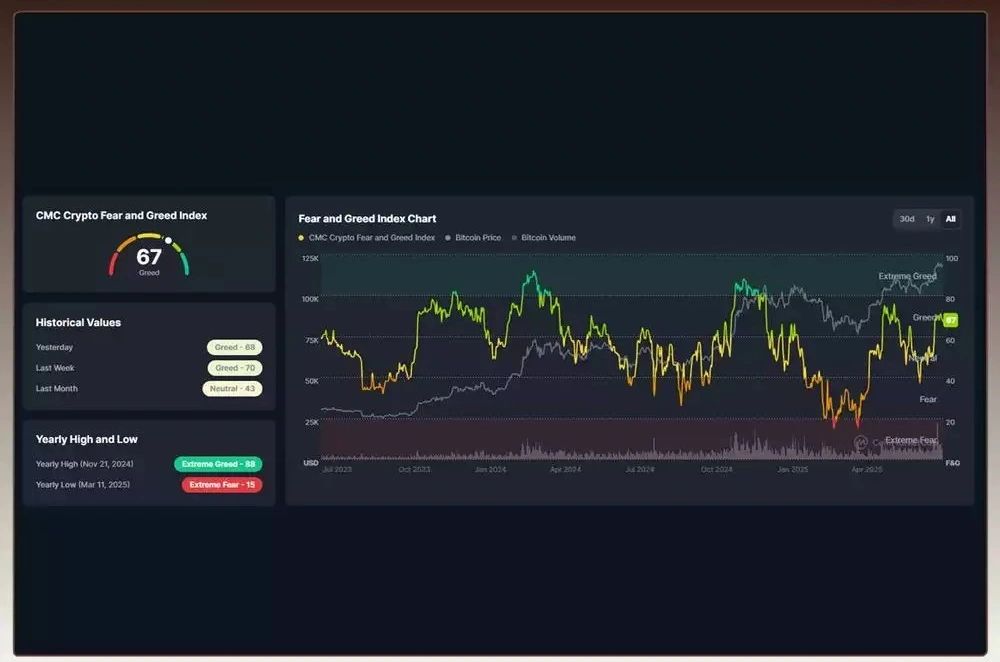
Overall sentiment remains sluggish—not collapsing, but clearly muted—which is telling in itself. Despite ongoing geopolitical risks and global uncertainty, Bitcoin has shown strong price resilience, hinting at underlying strength in the market.
The Fear & Greed Index recently underscored its reliability, having dropped into “Extreme Fear” just weeks ago—a historically contrarian buy signal. At the time, sentiment was deeply bearish, but price action told a different story. Since then, Bitcoin has rallied sharply, and the index now sits at 67—well into “Greed” territory.
The speed of this shift is noteworthy. While it marks a meaningful sentiment recovery, such rapid turnarounds often reflect underlying fragility. This suggests potential for short-term volatility, even as the broader trend remains constructive.
Fear and Greed
FOMO Finder Reinforces Cyclical Signals
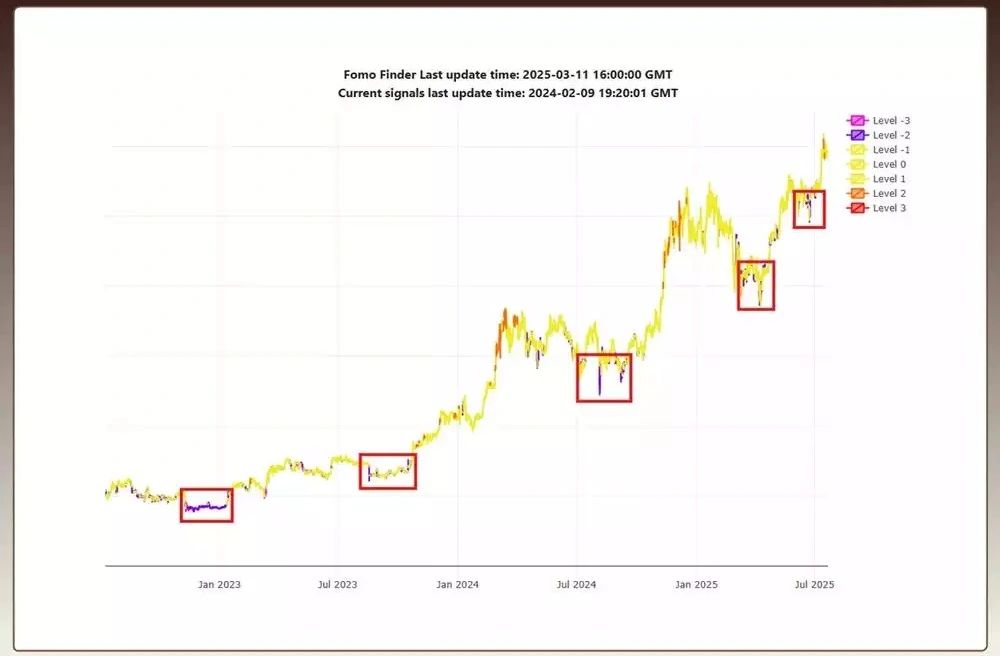
The FOMO Finder continues to show a consistent weekly cycle. Historically, its purple “fear” signals have aligned with significant market lows. The latest example followed a sharp sell-off that triggered widespread liquidations and heightened fear—only to be met by a swift rebound. This is the kind of price action that often marks pivotal turning points.
The indicator has since moved into the yellow zone, suggesting reduced fear without tipping into greed. While not a standalone tool, the FOMO Finder is a strong confirmation signal—particularly when it aligns with broader market data, as it has recently.
FOMO Finder
Muted Retail Interest Supports Institutional Narrative
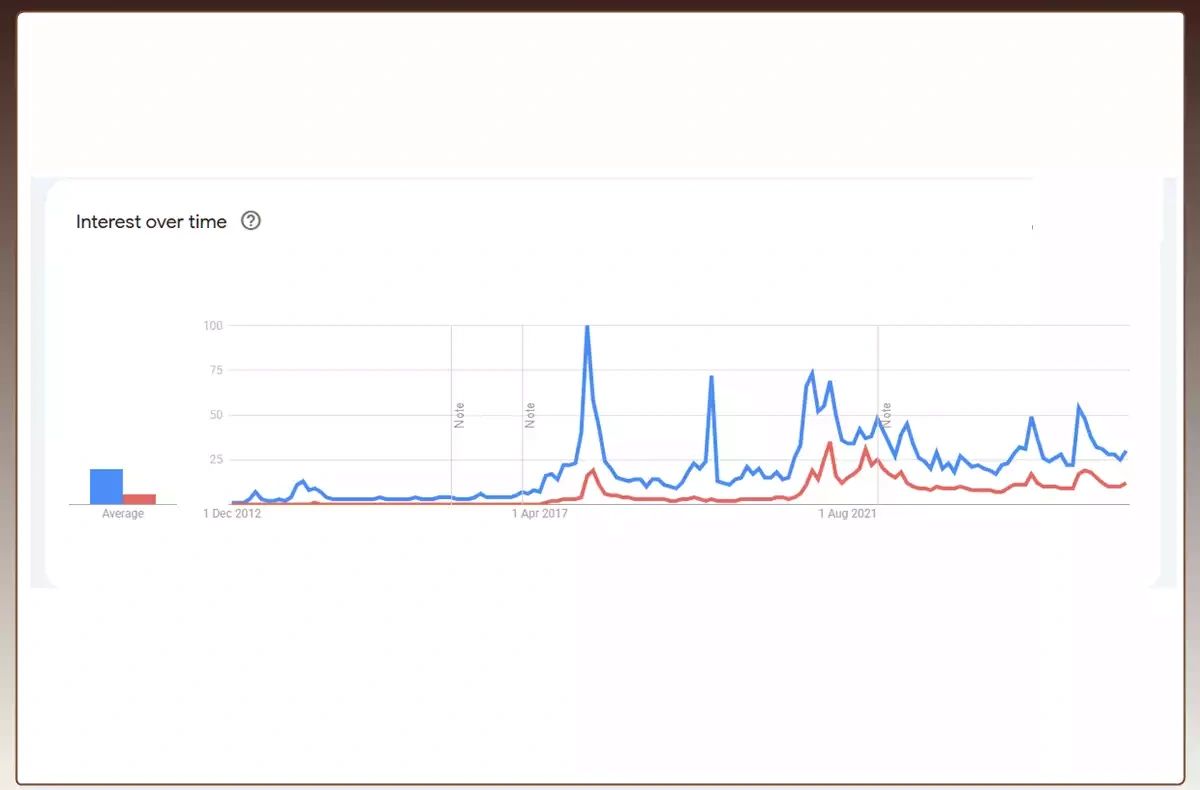
Google Trends data adds another layer to this picture: retail interest remains subdued. Even as Bitcoin approaches previous all-time highs, search volume for “Bitcoin” continues to decline. A brief spike last November, likely tied to the Trump news cycle, quickly faded.
This supports the broader consensus that the current rally is being driven largely by institutional flows, not retail hype. Crypto awareness remains high, but enthusiasm hasn’t returned to mainstream levels. That absence of speculative froth suggests further upside potential.
Google Interest
Funding and Positioning Tilt Bullish
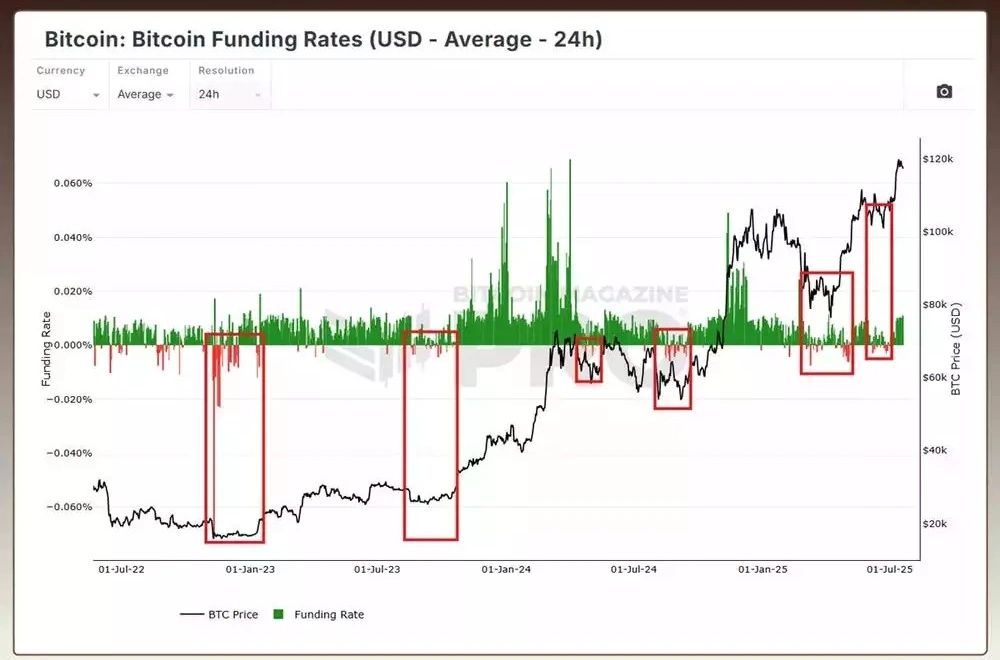
Funding rates have climbed again, signalling a shift out of the recent choppy phase. After briefly dipping negative—typically a bullish contrarian indicator—we saw a sharp upside move. Now, with funding firmly positive, bullish positioning appears to be returning.
Signs of growing long exposure are emerging, though not yet at levels typically associated with major corrections. The market seems to be transitioning from balanced consolidation toward a more directional stance.
Bitcoin rarely stays in low-volatility environments for long. The recent calm may have been the setup for a more dynamic move. While there are no guarantees, broader technicals and macro conditions continue to support an upside resolution.
Mid-Cycle Dynamics and Liquidity Divergence
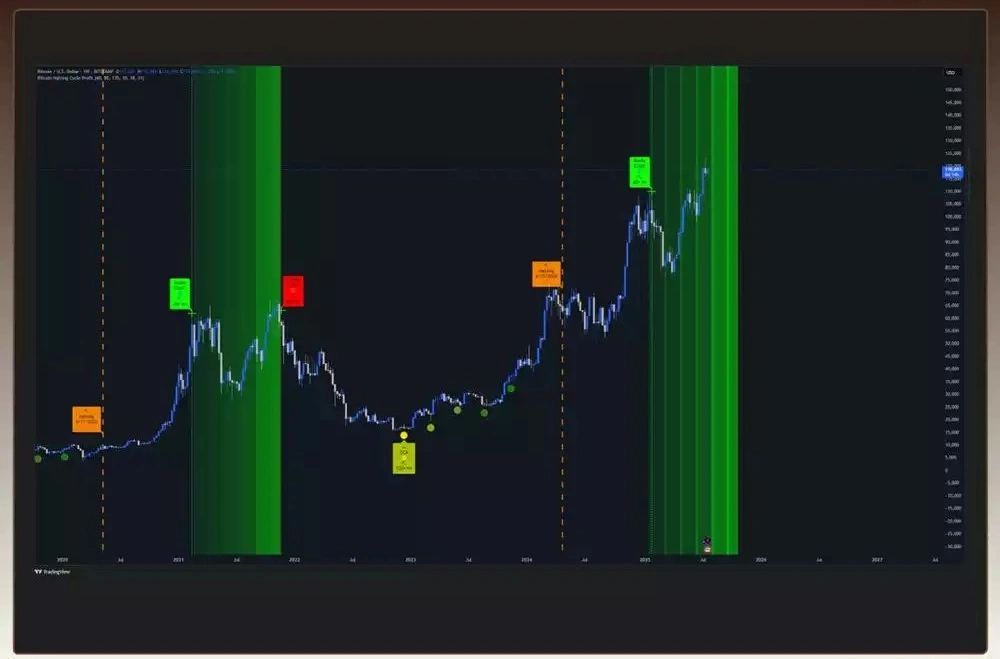
Zooming out, the macro context suggests we’re still in a mid-cycle expansion phase. Liquidity is rising—albeit slowly—and that typically supports higher asset prices. However, a divergence has emerged: Bitcoin’s price has outpaced what current liquidity conditions would normally justify.
Back in March, the picture was more cohesive: rising liquidity, strong technicals, and cautious sentiment created a compelling setup. Today, while price has accelerated, liquidity hasn’t kept pace. That disconnect introduces a degree of caution.
The medium to long-term view remains positive, but near-term conviction has moderated compared to last month.
BTC Macro Cycles
Weekly Cycles
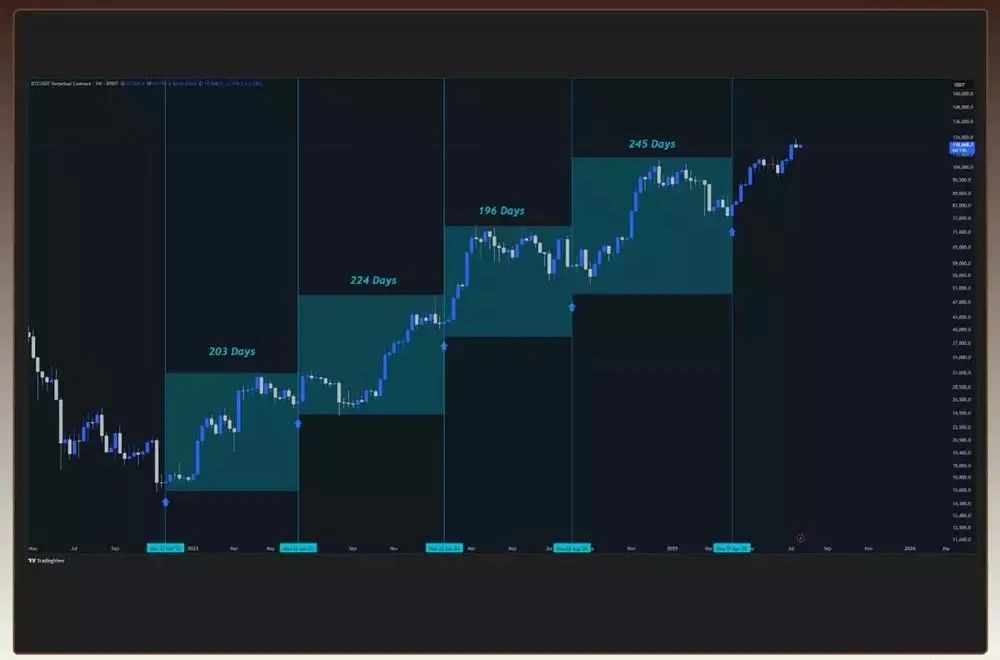
Weekly cycles now appear somewhat extended. The Stochastic RSI is flattening near its upper band—historically a zone that often precedes increased volatility. We’ve seen this pattern before: while price can continue higher, sustaining momentum becomes more difficult at this stage.
The cycle has been remarkably rhythmic, but we’re now back in uncertain territory. A period of consolidation—or a healthy pullback—would be a natural development to reset the trend.
$110K Zone Gaining Technical Significance
From a volume perspective, Bitcoin is hovering around the $110,000 level. The longer it consolidates here, the more significant this zone becomes. Should price break higher, this region could act as strong support. If we retrace, it may instead become meaningful resistance.
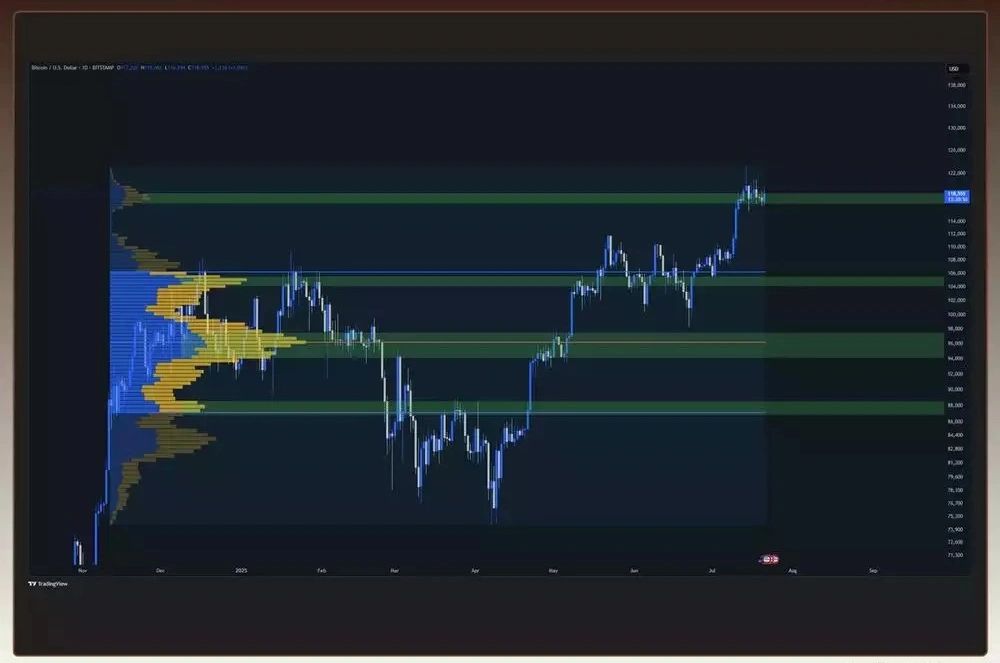
Market Structure Supports Consolidation
Short-term structure remains bullish, with a pattern of higher highs and higher lows—an encouraging sign. The key question now is whether this structure holds. A break below the recent swing low would undermine the current setup and shift sentiment.
For now, the market appears to be leaning toward consolidation and the formation of a higher low. Waiting for confirmation here would be prudent before taking a more aggressive position.
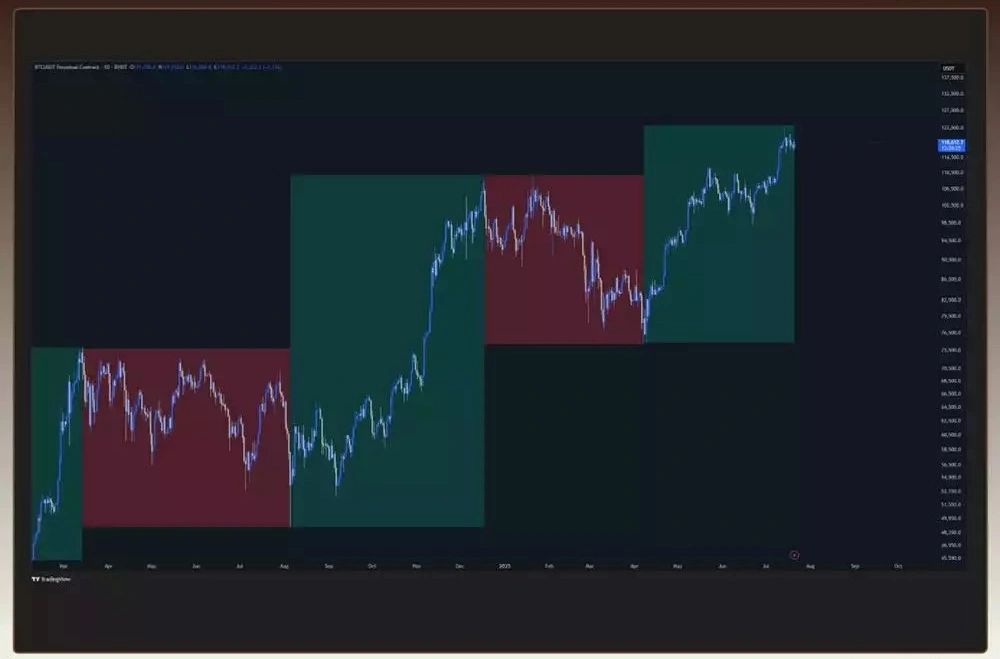
August Outlook: Monitoring Key Market Catalysts
Looking ahead, Bitcoin faces a pivotal test at the $117k level. A weaker market could push prices to $105k–$108k, while favorable macroeconomic conditions could propel Bitcoin to $130k. Key events to watch in August include:
- Solana’s Seeker Ships launch (August 4), which could spark Layer-1 rotations.
- Economic data such as CPI and GDP reports (mid-month), impacting the Fed’s rate cut expectations.
With Ethereum’s momentum and staking at 29.4%, Ethereum is likely to continue to test $4,000, while altcoins may see increased volatility. DeFi and RWAs are expected to perform well, benefiting from ongoing regulatory support.
Bitcoin (BTC)
Bitcoin volatility may increase because of the Cboe Volatility Index (VIX) seasonality. Historically, the VIX, which measures S&P 500 volatility, surges in August after declining in July. The VIX fell for a third straight month, potentially setting the stage for increased volatility and risk aversion on Wall Street. This could lead to a stock market decline, impacting BTC, which often follows Wall Street sentiment. BTC’s implied volatility indices have shown a positive correlation with the VIX, suggesting it could experience similar volatility.
Ethereum (ETH)
ETH’s evolution as a treasury reserve asset is likely to accelerate in the near future. The continued migration of public and private corporate capital into ETH — driven by staking rewards, DeFi integration, and increasingly normalised regulatory frameworks — positions ETH not just as a ‘digital gold’ alternative, but as a productive, core building block of corporate finance and Web3 infrastructure. This should result in tighter supply, higher yield-driven demand, and growing institutional alignment, fueling both network and price growth.
Standard Chartered forecast ETH could surpass $4,000 by year-end (and it has recently done that in early August), with other bullish analysts citing even higher targets if treasury demand accelerates, it is looking ever likely that we will see ETH rise far higher than many (including myself), have predicted. Eth has definitely turned more bullish and appears to have shaken the shackles of its past.
The top cryptocurrencies to buy in August 2025 are being defined by institutional flows, regulatory backing, and real-world utility. Bitcoin, Ethereum, XRP, Cardano, and Solana each offer a compelling case for long-term growth in this evolving market. There are others such as Chainlink and Hbar that also stand head an shoulders above others. The best cryptocurrencies to mine currently are BTC and Scrypt mining (Doge and Litecoin). These have been solid performers over multiple cryptocurrency cycles. Other noteworthy additions are projects like Kaspa, Kadena and Aleo and another that we have been mining since its inception CKB – Nervos network. These all offer unique projects but are much more speculative in their nature.
The cryptocurrency market is currently experiencing a shift, with increased regulatory scrutiny and a focus on utility and long-term value. Major cryptocurrencies like Bitcoin (BTC) and Ethereum (ETH) are leading the charge, supported by institutional interest and technological advancements. Bitcoin is expected to test critical price levels, while Ethereum continues to dominate the decentralized finance (DeFi) space.
August 2025 is packed with market-moving events, including inflation data releases and significant token unlocks that could impact prices. For instance, major token unlocks are scheduled, which may lead to short-term volatility but could also present buying opportunities for investors.
Will we see a pullback in the share market that will also affect the crypto market or will we see a reduction in interest rates that will propel the markets forward as consumers gain more confidence?

Stay the course, keep on learning and investing. But invest wisely, build wisely. The entire point of getting your money in order is so that you can enjoy life without being restricted by money.
Compound interest is the most powerful (and often overlooked) force in with investing. It rewards consistency and multiplies your investments with time.
And once you understand it, you’ll never see investing the same way again. Hopefully this blog and market update has shed some light on what to look for in the market and can provide you with more tools to assist you better navigate this and all stages of the market cycles.
Keep on investing and keep on mining.
Happy Mining
Rusty Rigs
Disclaimer: The content on this site and in this communication should not be considered investment or financial advice. Any investing or crypto mining is speculative. When investing your capital is at risk, please do your own research and invest and make your decisions wisely. Mining profits are not guaranteed and may vary over time depending on the market performance and network hashrates. The views and opinions expressed by the author are for informational purposes only and do not constitute financial, investment, or other advice.