
June & EOFY Action – June Markets 2025


As we see the Crypto market heat up and Bitcoin hit another ATH is a crypto bullrun imminent, let’s take a look at what happened in June within the crypto and wider financial markets and where the markets are likely heading. June was a month of volatility and resilience for Bitcoin, which dipped due to heightened Middle East tensions but rebounded by month-end on easing geopolitical risk.
Bitcoin started June near $105,000 USD but dropped to $98,200 USD after a U.S. airstrike on Iranian nuclear sites, reflecting heightened sensitivity to geopolitical risk. The decline reversed after a June 24 ceasefire between Israel and Iran, with BTC rebounding toward $108,000 USD by month-end, producing the overall growth of 3.9%. Meanwhile, the Fed held rates steady, signaling potential cuts later in 2025. However, persistent inflation, new China tariffs, and looming trade tensions kept markets cautious but resilient.

The crypto market demonstrated quite remarkable resilience, recording an overall growth of 2.62% despite a turbulent macroeconomic environment, but that was just the beginning as we have seen July kick into action and further growth and price action moving nicely northwards. After weeks of geopolitical tensions in the Middle East and concerns about global energy supplies, the markets found a new equilibrium in the second half of June. The overall capitalization of cryptocurrencies rose by 2.62%, a sign of confidence from investors.

The undisputed protagonist and leader was Bitcoin, which reached a new peak of dominance at 65%, a level not seen since 2021. The King of crypto gained 3.9%, confirming its perception as a safe-haven asset during phases of uncertainty. Investors continue to prefer liquid and established assets, to the detriment of many altcoins that have suffered.
In support of the stability of the sector, the robustness of the flows on ETF crypto platforms has also been reconfirmed, which demonstrates a growing interest from institutional investors, strengthening the overall maturity and liquidity of the market.
HYPE and BCH shine, ADA and DOGE disappoint
DeFi: Ethereum on the rise, Tron crashes
In the decentralized finance sector, the Total Value Locked (TVL) recorded a decrease of 2.19% compared to the previous month, amid significant risk aversion. However, Ethereum saw its market share increase significantly, strengthening its leadership over the DeFi ecosystems.
Bad instead for BNB Chain, Solana, and Arbitrum, which have lost ground. Particularly severe is the collapse of Tron, which saw 2 billion dollars withdrawn from lending protocols and a 62% drop in DEX volumes.
NFT: Immutable reaches the top, Ethereum yields
The NFT market showed encouraging signs in June, with a 7.22% increase in sales volume, supported by the general crypto market bull and the growing interest in gaming applications.
Ethereum, historic leading platform for NFT, has experienced a drop in sales of 49.9%, falling to third place. In contrast, Immutable has recorded an extraordinary growth of 215%, thanks to the success of the game Guild of Guardians, which has dominated sales among the main collections. Polygon has also maintained the second position (+12%), driven by the Courtyard collection.
This evolution confirms how the NFT sector is gradually maturing, moving from simple collecting to more concrete and innovative use cases, particularly in gaming.
June 2025 confirmed the ability of the crypto sector to withstand unfavorable macroeconomic conditions and to continue innovating. The established dominance of Bitcoin, the growth of DeFi on Ethereum, and the transformation of NFTs into useful assets in gaming represent positive signals.
However, the prospects remain tied to external factors, such as the evolution of geopolitical tensions and regulatory decisions, particularly in the United States. Investors will likely continue to balance caution and the search for opportunities, favoring solid assets like BTC and selectively targeting emerging sectors like NFT and stablecoins. As investor confidence grows so does speculation and this is where we will see a rise in memecoin dominance via the major meme platforms pump.fun and LetsBonk and others.
Circle’s landmark IPO signaled rising confidence in crypto’s capital market maturity. Real-World Assets (RWA) continued their sharp climb, supported by regulatory breakthroughs in the U.S., Europe, and Asia. Stablecoin issuance rebounded to $5 billion, preserving the market’s bullish foundation despite macro headwinds. Together, these events point to a digital asset landscape that’s evolving quickly from speculation toward institutional-scale adoption.
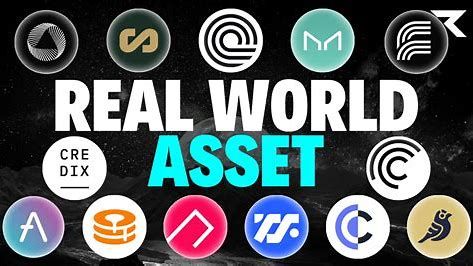
RWA Explosive Growth
Real-World Assets (RWAs) solidified their position as one of the fastest-growing sectors in crypto. Excluding stablecoins, the on-chain RWA market cap soared past $23 billion, marking an 85%+ year-to-date gain. When stablecoins are included, the tokenized real-world asset market exceeds $200 billion in size.
Ethereum continues to dominate the RWA space, holding a 59% market share. Among the standout performers is BlackRock’s BUIDL fund, which has grown to $2.7 billion in assets, becoming a critical engine behind RWA total value locked (TVL).
The surge in RWAs is backed by decisive regulatory momentum. In the U.S., the Senate passed the GENIUS Act, which provides regulatory clarity for dollar-backed stablecoins and RWA instruments. In Europe, MiCA (Markets in Crypto-Assets) regulations went into full effect in December 2024. Asia followed, with Hong Kong and Singapore launching sandbox environments designed to test and scale tokenization infrastructure.

Global Regulation: Stablecoins and Tokenized Assets
On the stablecoin front, the market recorded a growth of 2.57%, favored by the approval of the GENIUS Act in the United States. USDC consolidated its position, slightly increasing its market share, even though USDT remains the dominant stablecoin.
On June 17, 2025, the U.S. Senate passed the GENIUS Act with strong bipartisan support (68–30), moving the legislation forward to the House of Representatives for further deliberation. The GENIUS Act seeks to advance innovation in dollar-backed stablecoins.
At the global level, the stablecoin landscape is evolving quickly under a wave of regulatory clarity and compliance reform. The European Union led the way by fully implementing its Markets in Crypto-Assets (MiCA) framework on December 30, 2024. In parallel, Hong Kong introduced its own regulatory regime for stablecoins on May 21, 2025, aligning local policy with international standards.

Stablecoin Inflows Rebound, But Utility Shifts Beyond Trading
Stablecoin issuance rebounded in June after several months of stagnation, rising to $5 billion. This reversal preserved the structural integrity of the current bull cycle, ensuring continued liquidity and capital depth within crypto markets.
However, the role of stablecoins may be evolving from trading and speculation toward payments. CoinEx Research suggests ongoing monitoring is needed to refine interpretation of stablecoin metrics in the current cycle.

Stock markets
June 2025 marked a remarkable recovery for US equity markets, capping off an exceptional second quarter despite earlier volatility triggered by tariff uncertainties. The month was characterized by record-breaking highs, declining bond yields, mixed commodity performance, and divergent cryptocurrency trends. International markets showed varied performance, with Japan leading gains while European and Chinese markets faced headwinds.

US Equity Markets: Strong Recovery
Exceptional Q2 Performance
US equity markets delivered outstanding returns in the second quarter of 2025, with major indices posting their best quarterly performance in over a year. The S&P 500 gained 10.57% for the quarter, while the Nasdaq Composite surged to 17.75%, marking its strongest quarterly showing since 2023. The Dow Jones Industrial Average advanced 4.98%, and the Russell 2000 small-cap index rose 8.28%.
The month began with cautious optimism as markets recovered from the April lows triggered by President Trump’s initial tariff announcements. Large-cap stocks (S&P 500) rose 6.3% in June, outperforming small-caps (Russell 2000) which gained 5.3%. Technology stocks were the standout performers, with the “Magnificent 7” stocks collectively returning 13.5% in May and continuing their momentum through June.
The S&P 500 reached new record highs on June 27, 2025, closing at 6,173.07, marking the first record high since February 19, 2025. Similarly, the Nasdaq Composite achieved record levels, benefiting from renewed artificial intelligence optimism and easing trade tensions.
Key Market Drivers
Several factors contributed to the robust equity performance:
• Trade tension de-escalation: The 90-day tariff reduction agreement between the US and China provided significant relief
• Corporate earnings strength: First-quarter financial results and forward guidance exceeded expectations
• Technology sector leadership: AI-related stocks drove much of the market gains
• Reduced market volatility: VIX declined to 16.3 by June 27, down from 19.8 at the week’s start

International Markets: Regional Divergence
China: Mixed Signals
Chinese equity markets showed mixed performance in June 2025, with the Shanghai Composite ending at 3,452 points, up 0.21% on July 1st. The market faced challenges from:
• Domestic vs. international sentiment divergence: A-shares and H-shares moved in opposite directions
• Manufacturing activity: Unexpectedly returned to expansion in June according to Caixin PMI
• Trade negotiations: Continued uncertainty despite framework agreements
Europe: Modest Declines
European markets faced headwinds in late June, with major indices closing lower on June 30th:
• German DAX: Down 0.51% to 23,909.61 points
• French CAC 40: Declined 0.33% to 7,665.91 points
• UK FTSE 100: Fell 0.43% to 8,760.96 points
India: Consolidation Phase
Indian markets showed resilience with the Sensex reaching above 84,000 for the first time since October 2024 on June 27th, though ending June on a softer note:
• Nifty 50: Closed at 25,517.05, down 0.47% on June 30th
• Sensex: Ended at 83,606.46, down 0.54%
• Sector performance: PSU Banks led gains with 2.6% rise, while realty and auto sectors lagged
Japan: Standout Performer
Japanese markets were the clear winner among major international markets in June 2025:
• Nikkei 225: Surged to 40,100, gaining 1.3% on June 30th
• Topix Index: Rose 1.1% to 2,835
• Key drivers: US rate cut expectations, trade optimism, and strong corporate fundamentals
Manufacturing PMI reached 50.1 in June, marking the first expansion in 13 months, though new orders continued to decline for the 25th consecutive month.
Major News and Market Developments
Trade Negotiations
June 2025 was dominated by US-China trade discussions held in London, where senior officials including Commerce Secretary Howard Lutnick and Chinese Vice Premier He Lifeng met to address ongoing tensions. The talks resulted in a framework agreement maintaining current tariff arrangements, with Trump stating the US would receive “55% tariffs” while China gets “10%”.
Monetary Policy Developments
The Federal Reserve’s June meeting maintained the status quo while signaling potential for two rate cuts later in 2025. The central bank revised economic projections, lowering GDP growth forecasts to 1.4% while raising inflation expectations to 3%.
Geopolitical Events
The Iran-Israel ceasefire announced by President Trump significantly impacted global markets, reducing risk premiums across energy and precious metals markets. This development contributed to the sharp decline in oil prices and reduced demand for safe-haven assets.
Corporate Developments
Coinbase emerged as the best-performing stock in the S&P 500 during June, gaining 43% as regulatory clarity improved and the company benefited from its inclusion in the benchmark index. The cryptocurrency exchange’s performance reflected broader institutional adoption of digital assets.
Outlook and Implications
June 2025’s market performance demonstrated remarkable resilience in US equities, supported by corporate earnings strength, trade tension resolution, and technology sector leadership. The 17.75% Nasdaq gain in Q2 highlighted the continued importance of AI and technology innovation in driving market performance.
The ASX
ASX June Winners: ASX 200 rose 1.4pc in June, up nearly 10pc for quarter
- Australia’s S&P/ASX 200 rose 1.4% in June, posting gains of almost 10% for Q2 CY25
- The S&P/ASX emerging companies was the only index in the red, down 0.41%
- Codeifai topped June winners, up 600% after announcing it was acquiring main competitor Trust Codes
Brushing aside inflation worries, trade tensions and geopolitical risks, the Aussie market followed global equities higher in June and Q2 CY25, according to S&P Dow Jones Indices (S&P DJI).
The ASX and global markets were briefly rattled by heightened geopolitical tensions following the Israel-Iran conflict in mid-June but ultimately proved resilient upon news of a ceasefire toward month’s end.
The S&P/ASX 200 closed 1.4% higher in June and posted an almost 10% gain for the quarter. Meanwhile, S&P DJI said US equities staged a dramatic recovery in Q2, with the S&P 500 “rebounding by over 20% since the tariff-related tumult experienced in early April”.
“Fuelled by robust corporate earnings from Big Tech and recent optimism surrounding potential upcoming tax cuts, The 500 reached another all-time closing high on the last trading day of the month, closing the quarter up 11%,” the world’s largest index provider said.
The S&P/ASX emerging companies was the only index in the red in June, down 0.41%.
Energy tops winning sectors in June
Five of the 11 sectors rose in June with energy leading the gainers up 9.01%, followed by financials up 4.28% and real estate rising 1.66%. Materials led the laggards, down 3.09%, followed by consumer staples dropping 2.27% and healthcare falling 1.05%.
There was plenty of news in the energy sector at home and abroad in June, with the Israel-Iran conflict initially pushing oil prices higher, though gains proved short-lived.
At home, a consortium of investors led by the state-owned Abu Dhabi National Oil Company (ADNOC) made headlines with its $30 billion takeover bid for Australia’s second largest gas producer Santos (ASX:STO).
S&P DJI said cyclical sectors within the S&P/ASX 200 saw a robust rebound during the market recovery in Q2, particularly led by technology and financials.
“However, materials lagged, along with defensive sectors such as utilities, health care and consumer staples.”

Steady fixed income as ASX VIX edges up
Fixed income indices continued to perform steadily amid the ongoing easing cycle by central banks, while in June, the S&P/ASX 200 VIX rose 0.99 points to 11.44, indicating a slight increase in market volatility expectations among investors.
Leading player in AI-driven QR code and brand protection technology Codeifai (ASX:CDE) topped the winners list in June, up 600%.
During the month Codeifai announced it was acquiring its main competitor Trust Codes, which runs serialised QR code traceability platform, with customers across Australia, New Zealand, the US and other global markets.
Perth-based icetana (ASX:ICE) rose 300% in June after locking in four agreements with SoftBank Robotics Group Corp and its subsidiaries with a total value of $3.6 million.
Softbank will become an exclusive distributor of icetana AI in Japan, committing to a minimum purchase agreement of US$450k on a recurring annual basis.
The Singapore arm of Softbank Robotics will also take a 17.6% stake in icetana with an investment of $1.87m, and the two companies will work together to integrate ICE’s AI analytics with Softbank’s automation and security solutions via a $1.08m three-year joint product development program.
Provider of data-centric software solutions for secure collaboration of sensitive information archTIS (ASX:AR9) rose 229% in June after two major contract wins in the defence space in the UK and US.
The company entered a three-year contractual agreement worth ~$263,000 with the UK arm of a large multinational aerospace and defence corporation, covering 400 of its NC Protect licences to help meet strict UK Ministry of Defence data security rules in Microsoft 365.
Following months of “rigorous testing by a leading government contractor” archTIS announced its NC Protect solution had passed a key evaluation milestone for secure collaboration within the US Department of Defense’s Microsoft DoD365 cloud, earning an initial 1,000-user deployment.
Unfortunately for me ADD – Adavale Resource Ltd was down 50% in June and was one of the top 50 worst performers on the ASX, fortunately it’s not a large portion of my share portfolio, but it is one that I have been speculating with. With none of my stocks making the top 50 Best performers list, it was a little dissapointing, although I did see a nice recovery across the board with 12-15% gains for June which is still over 10% better than the ASX market average.
Now Back to Bitcoin and Crypto….

Bitcoin –How even a tiny amount could net you massive returns
In the last year, bitcoin has made some significant steps forward as institutional and corporate adoption of digital assets continues. The launch of spot bitcoin ETFs in the United States improved clarity around regulation, and the take-up of adjacent use cases such as stablecoins have all given investors more confidence in digital assets.
However, while there have been some meaningful steps forward in terms of adoption, digital assets remain volatile with a penchant for becoming susceptible to hype – begging two questions, is it worth considering an allocation to bitcoin within a diversified investment portfolio? And if so, how large should that allocation be?
In short, historical data suggests that a small allocation to bitcoin has the potential to deliver meaningfully higher returns without materially increasing risk at a portfolio level.
But as that allocation increases the marginal improvement in risk-adjusted returns starts to dissipate. So, like many things in life, it’s possible to have too much of a good thing, and any allocation to bitcoin should be sized accordingly.
When it comes to building an investment portfolio, the main game remains diversification across asset classes – such as Australian and international equities, bonds, cash and commodities including gold. Even within crypto investing and crypto mining I recommend some level of diversification. Adding a 2.5 per cent bitcoin allocation with quarterly rebalancing can improve the cumulative return of a portfolio to 187 per cent.
The other important consideration is time horizon and risk tolerance. For example, a person approaching retirement might have a higher allocation towards defensive assets such as fixed income compared to an accumulator investor with a longer time horizon.
Here’s a look at simulated investment implications of adding bitcoin to a hypothetical Australian investor’s portfolio with a 70/30 split to equities and bonds – that comprises a 35 per cent allocation to Australian equities, a 35 per cent allocation to international equities, and a 30 per cent allocation to Australian bonds.
As you’d expect, adding an allocation of bitcoin to a portfolio boosted returns over the 10-year period between 2015 and 2024. However, the size of a bitcoin allocation did have some meaningful implications, particularly beyond 5 per cent where volatility and drawdowns increased.
During the period between 2015 and 2024, a 70/30 portfolio without a bitcoin allocation returned 123% on a cumulative basis, assuming quarterly rebalancing, which translates to an annualized return of 8.37% per year.
By comparison, adding a 2.5 per cent bitcoin allocation with quarterly rebalancing would have improved the cumulative return of the portfolio to 187%, or 11.15% per year.
This would have been achieved without major changes in either the portfolio’s volatility (8.68% a year with bitcoin versus 8.36% a year without) or its maximum drawdown (21.18% with bitcoin compared to 21.02% without).
At the same time, a 5 per cent allocation to bitcoin would have boosted the cumulative return of the portfolio to 266.81% (or 13.88% a year). However, at this level, portfolio volatility sat higher at 9.51% while the maximum drawdown was 21.42%.
Beyond a 5 per cent allocation to bitcoin, the hypothetical portfolio became a lot more volatile and the maximum drawdown was higher – as were returns. At a 10 per cent allocation to bitcoin, returns were higher at 19.2% per year, but volatility was 12.04% and the maximum drawdown was 22.55%.
As all investment firms and products say past performance is no guarantee of future results, the above example is provided for illustrative purposes only, it’s a worthwhile lesson about the importance of asset allocation when building a portfolio and this applies to investment portfolios as well as crypto mining portfolios.
The reality is most investors should hold their largest portfolio allocations in more established asset classes, such as Australian and international equities, bonds and possibly commodities such as gold, depending on their individual circumstances. When it comes to mining I favour Scrypt mining, then Bitcoin mining and ETC mining as the more stable options for longer term growth and stability over the newer and more volatile Alts such as KAS, ALEO, CKB, KDA and others. However, I’m not saying don’t mine those or don’t invest in those – Invest in and mine what you believe in, invest in and mine good projects for future growth and potential but don’t base your whole strategy on those higher volatile Alts, have your foundation in the more stable assets for returns that are more reliable and more fixed over time. Take a similar approach as you would with investing in shares or with your super mix. I realize some will be more risk averse and others will be more cautious – seek the right financial advice and stick to a strategy that works for you and revisit this periodically to ensure that you stay on track and move with the times.
Over the long term, a well-rounded portfolio that takes advantage of the natural compounding power of the market with regular portfolio contributions (via mining or investing) not only serves as a powerful tool for long-term wealth creation, but also helps investors sleep well at night by turning down the noise associated with volatility and appreciating a more stable mix of assets without having a toe or two dipped in there for those moonshot events!

The Future of Money Is Here
Sixteen years after the launch of Bitcoin, it’s clear the future of money is here and at its center: stablecoins. A survey of Fortune 500 executives and small and medium businesses (SMBs) found that 81% of crypto aware SMBs are interested in using stablecoins in their business and the number of Fortune 500 companies who say their company plans to use or are interested in stablecoins increased more than 3x compared to 2024 findings. With over 161 million stablecoin holders globally, plus a 54% growth in global stablecoin supply year-over-year, 2025 is shaping up to be the breakout year for stablecoins.
2025 has marked crypto’s turning point, driven by the surge of digital asset adoption, real-world tokenization, and growing institutional and small business engagement. At the center of it all, stablecoins have emerged as the dominant force powering on chain utility and real-time, global payments. According to new research by The Block Pro Research, organic stablecoin transfer volume has reached unprecedented levels with the two highest monthly volume transfers in history happening in the last 12 months. December 2024 set a monthly volume record of $719 billion, followed closely by April 2025’s $717.1 billion.
Consumers, institutions, and small and medium businesses (SMBs) alike have identified stablecoins as a key solution to addressing their biggest financial pain points. Use cases include remittances with near-instant and low-cost cross border transactions, lower payment processing fees, increased payroll efficiencies, inflation protection, and bridging payments gaps for the under and unbanked.
- Stablecoins are facilitating faster money movement, updating outdated financial systems. Nearly 1 in 5 Fortune 500 executives consider on chain initiatives a key part of their company’s strategy, marking a 47% year-over-year increase. Additionally, 81% of crypto-aware SMBs are interested in using stablecoins to address their biggest financial pain points, including fee and transaction processing. It’s a belief that’s catching on quickly, especially with more than three times as many Fortune 500 executives now planning to use or exploring stablecoins compared to just last year.
- Crypto helps address the top financial pain points facing SMBs. 82% of SMBs say crypto can help solve at least one of the pain points their business faces, up from 68% a year ago. In 2024 the annual stablecoin transfer volume reached $27.6 trillion, surpassing a combined volume of Visa and Mastercard in 2024 by over 7.68%, highlighting their realized potential for businesses as a faster, cheaper, and more scalable solution for cross-border payments.
- Regulatory clarity is the unlock for crypto’s next chapter. As we publish this report, there is an emerging patchwork quilt of legislation in the U.S., including the stablecoin bill GENIUS Act, marking momentous traction for the industry. It is past time for a regulatory unlock that will strengthen broader crypto and we welcome legislation that protects consumers and encourages innovation, adoption. An overwhelming 9 in 10 Fortune 500 executives agree that clear, consistent U.S. regulation around crypto, blockchain, and onchain technologies is essential to support ongoing innovation.
The rise of on chain activity and accelerating global adoption signal a fundamental shift in the evolution of money, with stablecoins emerging as a primary catalyst, powering real-world use cases and driving the next wave of digital financial integration.

Looking Ahead: Macro Risk, Rate Cuts, and Strategic Rotation
As the second half of 2025 begins, crypto markets face a mix of opportunity and risk. While the Iran-Israel ceasefire has eased geopolitical tensions, inflation, tariffs, and macro uncertainty persist. Bitcoin remains technically strong near its range high, and having recently broken out and surpassing it’s previous ATH. With BTC dominance holding firm, an altseason pump appears somewhat unlikely for now, but may not be too far off.
Institutional momentum—from rising ETF flows to Circle’s IPO—reflects growing confidence in foundational crypto infrastructure. At the same time, the rapid rise of RWAs and global regulatory milestones like the GENIUS Act, MiCA, and Asia’s sandbox initiatives signal a shift toward a more mature, policy-aligned market. July may prove pivotal as capital rotates toward utility, compliance, and real-world use cases.
Where could we be heading this quarter? Will we see BTC breakthrough the $130k USD price point? With October and November traditionally strong for BTC we could well see a +$150k USD price point for BTC before 2025 is out. But the question on everyone’s lips is when the Alts are going to pump? Numerous Altseasons have occurred in the past decade, all commencing right after a decline in Bitcoin dominance. The more significant the drop in BTC dominance, the more substantial the subsequent Altseason.
If 75% of the Top 50 coins performed better than Bitcoin over the last season (90 days) it is Altcoin Season. Excluded from the Top 50 are stablecoins (Tether, DAI…) and asset backed tokens (WBTC, stETH, cLINK,…)
We are still firmly in Bitcoin season, some are suggesting that we won’t see the big Altcoin season pump until 2026. Pending Bitcoins performance and dominance through July there may be a chance of an Altcoin pump in August and September. Altcoins have plenty more upside, as many are already surging without pulling much market share from Bitcoin.
While BTC Dominance stayed relatively steady, the recent altcoin surge could signal that fresh capital is flowing into the wider market. We may see a pump or a series of mini pumps but according to some analysts another Altcoin pump and a larger Altcoin pump could be likely in the period August/September 2025 or as late as 2026 March to May window (depending on Bitcoins dominance and Bitcoins ATH for this market cycle reached by either October or November this year or if it can drive further next year and diverge away from tradition it all depends on whether the market has enough to sustain it and what occurs on the macro level.
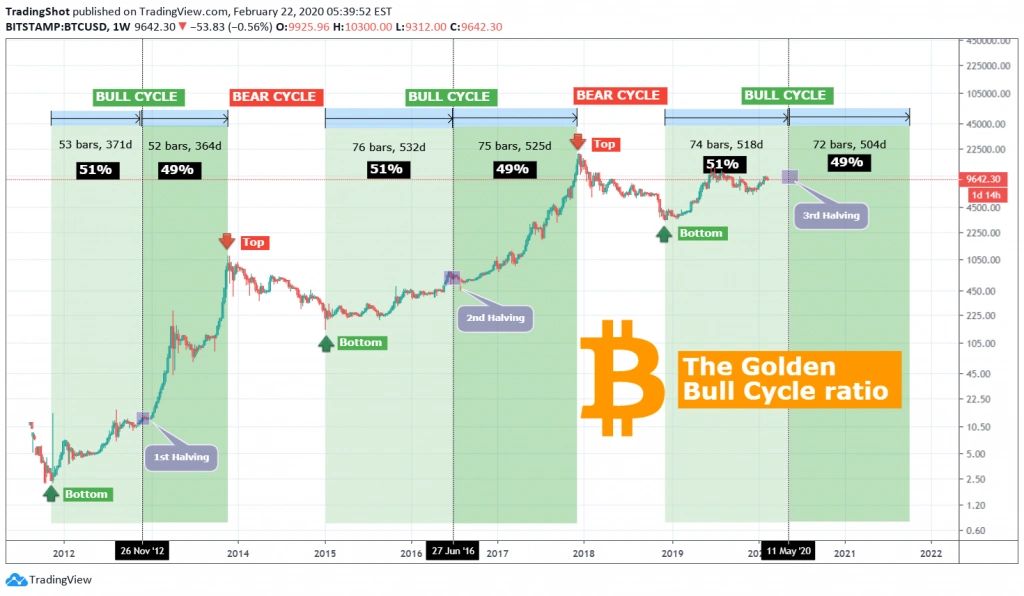
Previous Cycles
If we look at previous cycles the theory is that we should see a cycle top for BTC by around October/November which would suggest that an Altcoin pump to finish the season should occure sometime between now and October.
CoinMarketCap’s Altcoin Season Index suggests the market is still heavily favoring Bitcoin, with the Index reading a “Bitcoin Season” score of 29 out of 100. As long as Bitcoin can maintain its position above a crucial psychological support level of around $110k, traders will likely feel comfortable redistributing profits into altcoins.
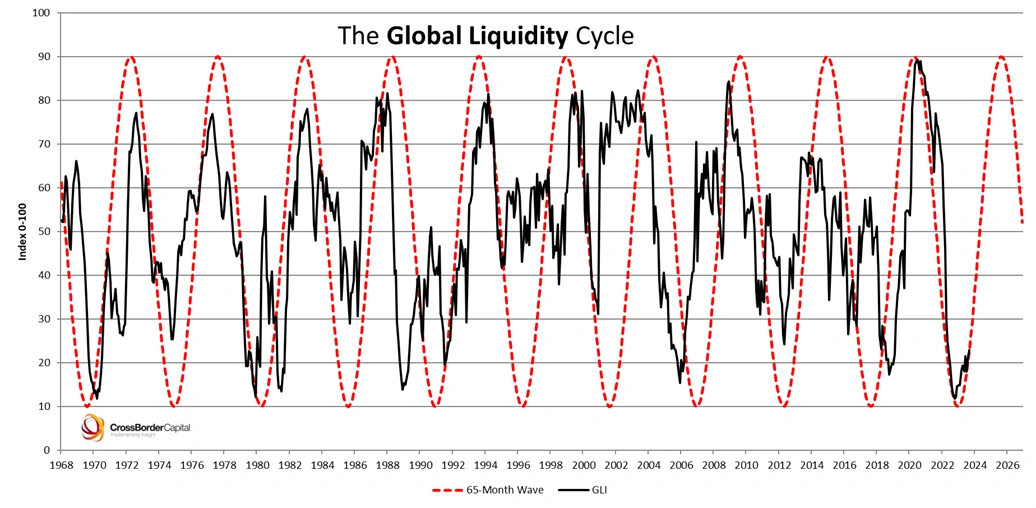
The Global Liquidity Cycle
The global money supply and cyclical liquidity, as measured by Global M2 YoY vs BTC, has also followed a four-year cycle. For instance, M2 liquidity bottomed out in 2015 and 2018, just as Bitcoin hit lows. In 2022, M2 again hit a low point, perfectly aligning with Bitcoin’s bear market bottom. Following these periods of economic contraction, we see fiscal expansion across central banks and governments everywhere, which leads to more favorable conditions for Bitcoin price appreciation and the wider crypto market pump.

Familiar Patterns
Historical price analysis suggests that Bitcoin’s current trajectory is strikingly similar to previous cycles. From its lows, Bitcoin usually takes around 24-26 months to break past previous highs. In the last cycle, it took 26 months; in this cycle, Bitcoin’s price followed a similar trend. Bitcoin has historically peaked about 35 months after its lows. If this pattern holds, we may see significant price increases through September and November 2025, after which another bear market could set in by the end of this year or early next year.
Following the anticipated peak, history suggests Bitcoin would enter a bear phase in 2026, lasting roughly 9 months to one year until the next cycle begins. These patterns aren’t a guarantee but provide a roadmap that Bitcoin has followed in previous cycles. They offer a potential framework for investors to anticipate and adapt to the market, but I stress it’s a loose framework as there is much talk about a super cycle and we have seen a slight divergence in the market beginning to emerge as we see more institutional investment and wider market uptake. Could this be the last traditional cycle, or could we see this cycle top emerge as the point of divergence away from previous cycles?
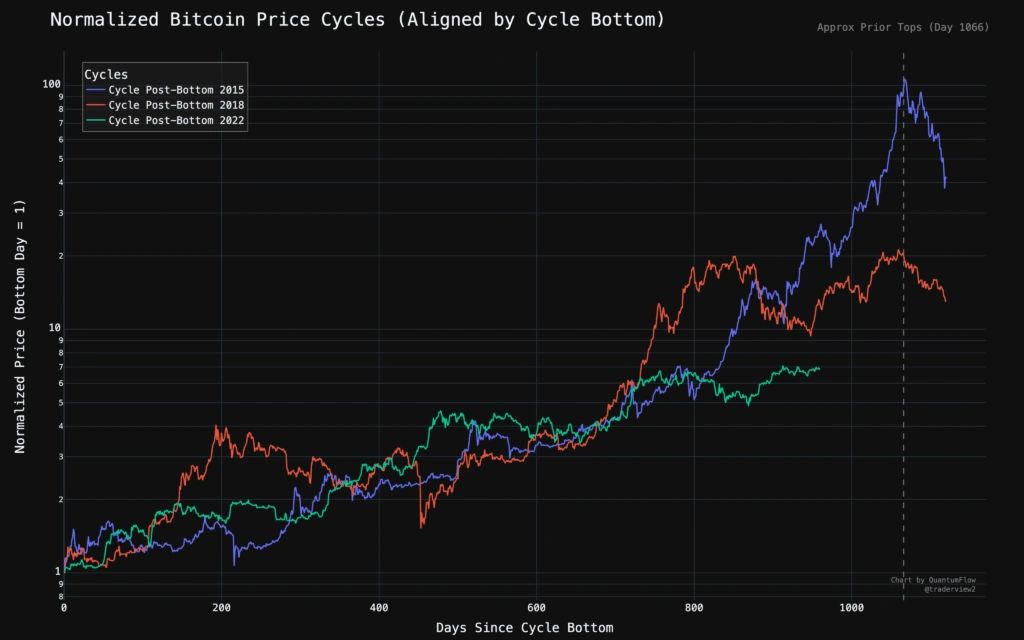
A recently published chart comparing Bitcoin’s price movements across three major cycles shows the cryptocurrency remains historically aligned as of Day 966. The data released July 8, 2025, by on Twitter, aligns Bitcoin’s current post-bottom trajectory with the 2015 and 2018 cycles.
With only 100 days remaining before the average historical cycle top (Day 1066), traders are eyeing a potential last leg surge.
According to the data, Bitcoin’s 2022 post-bottom cycle continues to track previous cycles’ patterns, particularly the 2015 cycle and 2018 cycle.
- Bitcoin’s cycle has now reached the same day range where major surges happened in past cycles
- The chart shows that the 2015 and 2018 cycles peaked near Day 1066, which gives the current market a 100-day window.
- Normalized price lines reveal the current trend is still closely following both past breakout timelines
Historical Patterns Reveal Predictable Post-Bottom Behavior
Each Bitcoin cycle appears to follow a consistent trend of bottoming out, followed by steady gains and a climactic final surge.
The 2015 post-bottom cycle peaked around Day 1066 with nearly a 100x return from its bottom, showcasing its historic strength. Meanwhile, the 2018 cycle peaked at a lower multiple, around 20x, also near Day 1066. Both cycles delivered exponential growth before their tops.
In contrast, the current cycle shows more gradual gains, sitting slightly above 3x growth as of Day 966. This modest ascent has mirrored the earlier stages of the previous cycles, supporting the theory of a yet-to-come final leg.
With the 1066-day peak acting as a benchmark, historical data aligns with the idea that Bitcoin’s next major move may be imminent and we have already seen July off to a great start for BTC tracking upwards and through new ATH’s.

Data-Backed Confidence Among Traders
Trader and analyst referenced this chart as support for a bullish thesis originally shared in April 2025. In the new post, he points to the consistency of historical tops occurring around Day 1066, offering insight to those anticipating Bitcoin’s next significant move.
By using normalized price metrics and aligning cycles at their respective bottoms, the chart creates an unbiased view of performance. Each curve begins at a normalized price of 1.0, ensuring clarity and comparability across the three cycles.
As engagement grows, many comments echo the sentiment that “history repeats itself,” suggesting strong community belief in cycle-driven price action.

Will Bitcoin Break Tradition or Continue Its Cycle?
The central question now is whether Bitcoin will again follow through with a final explosive rally, as seen in prior cycles. Historical precedent places that top near Day 1066, drawing increased attention to the next three months of market behavior. The M2 Money supply for the 4 major banks pulled back on the previous 3 cycles, we are still seeing the M2 supply grow across the 4 major banks and there has not been a massive spike yet. If we see QE introduced at some point in the coming months and further rate cuts this may usher in the next phase of the crypto cycle as we see market confidence grow and money flow towards more risk on assets.
Despite challenges, Bitcoin’s four-year cycle has endured, largely due to its supply schedule, global liquidity, and investor psychology. As such, the four-year cycle remains a valuable tool for investors to interpret potential price movements in Bitcoin and our base case for the rest of this cycle. However, relying solely on this cycle could be shortsighted. By incorporating on-chain metrics, liquidity analysis, and real-time investor sentiment, data-driven approaches can help investors respond effectively to changing conditions.
There is no doubt that the crypto market is evolving, the theory that we will see less volatility across some of the assets appears to be ringing true (especially for Bitcoin). As Bitcoin stands at a critical juncture, the coming days and weeks will test whether this data-backed narrative holds—or diverges into new territory, either way the data is clear….. it’s definitely worth holding, accumulating and mining Bitcoin over the long term.
Happy Mining
Rusty Rigs
Disclaimer: The content on this site and in this communication should not be considered investment or financial advice. Any investing or crypto mining is speculative. When investing your capital is at risk, please do your own research and invest and make your decisions wisely. Mining profits are not guaranteed and may vary over time depending on the market performance and network hashrates.